Estimated Value: $152,000 - $172,000
3
Beds
1
Bath
1,486
Sq Ft
$108/Sq Ft
Est. Value
About This Home
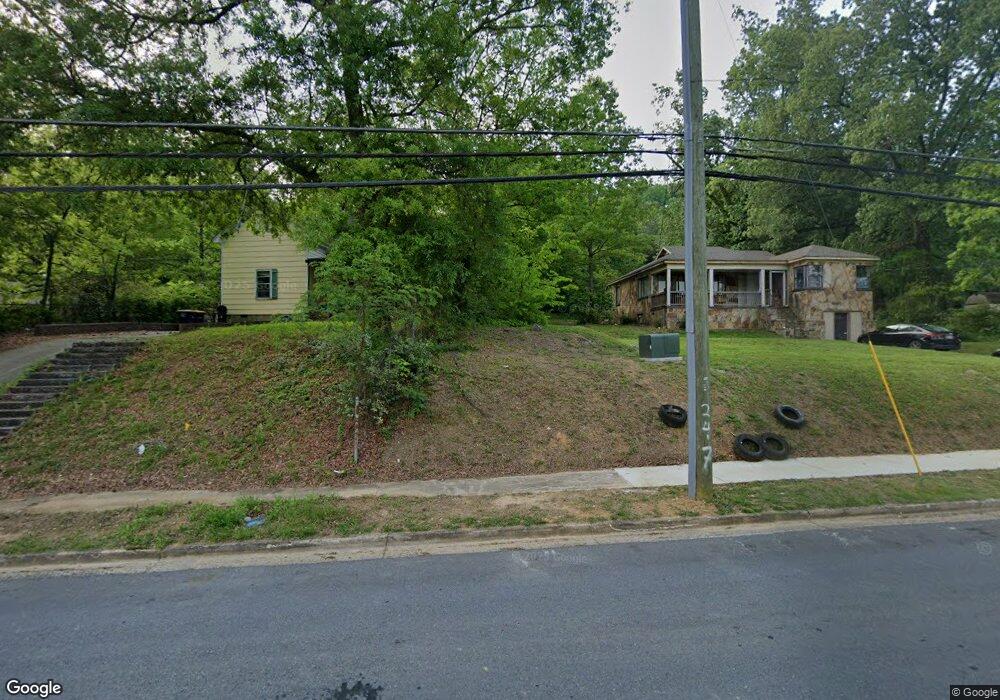
This home is located at 823 S Broad St SW, Rome, GA 30161 and is currently estimated at $160,430, approximately $107 per square foot. 823 S Broad St SW is a home located in Floyd County with nearby schools including Dan McCarty Middle School, Rome High School, and Darlington School.
Ownership History
Date
Name
Owned For
Owner Type
Purchase Details
Closed on
Mar 31, 1982
Sold by
Major Gas & Oil Co
Bought by
Gibson Ann N
Current Estimated Value
Purchase Details
Closed on
Mar 30, 1982
Sold by
First Realty & Dev Co Inc
Bought by
Major Gas & Oil Co
Purchase Details
Closed on
Jun 10, 1977
Sold by
Culberson Francis
Bought by
First Realty & Dev Co Inc
Purchase Details
Closed on
Jan 2, 1976
Sold by
Shaw Will H Mrs
Bought by
Culberson Francis
Purchase Details
Closed on
Jan 1, 1976
Sold by
Smith Frances F
Bought by
Shaw Will H Mrs
Purchase Details
Closed on
Jan 1, 1969
Sold by
Shaw Will H
Bought by
Smith Frances F
Purchase Details
Closed on
Jan 1, 1965
Sold by
Payen Mather M
Bought by
Shaw Will H
Purchase Details
Closed on
Jan 1, 1964
Sold by
Howell P S Est
Bought by
Payen Mather M
Purchase Details
Closed on
Jan 1, 1901
Bought by
Howell P S Est
Create a Home Valuation Report for This Property
The Home Valuation Report is an in-depth analysis detailing your home's value as well as a comparison with similar homes in the area
Home Values in the Area
Average Home Value in this Area
Purchase History
| Date | Buyer | Sale Price | Title Company |
|---|---|---|---|
| Gibson Ann N | $23,000 | -- | |
| Major Gas & Oil Co | $23,000 | -- | |
| First Realty & Dev Co Inc | $3,000 | -- | |
| Culberson Francis | -- | -- | |
| Shaw Will H Mrs | $2,000 | -- | |
| Smith Frances F | -- | -- | |
| Shaw Will H | $1,200 | -- | |
| Payen Mather M | -- | -- | |
| Howell P S Est | -- | -- |
Source: Public Records
Tax History Compared to Growth
Tax History
| Year | Tax Paid | Tax Assessment Tax Assessment Total Assessment is a certain percentage of the fair market value that is determined by local assessors to be the total taxable value of land and additions on the property. | Land | Improvement |
|---|---|---|---|---|
| 2024 | $1,664 | $42,578 | $4,928 | $37,650 |
| 2023 | $1,508 | $40,380 | $4,480 | $35,900 |
| 2022 | $983 | $26,935 | $3,584 | $23,351 |
| 2021 | $895 | $24,107 | $3,584 | $20,523 |
| 2020 | $821 | $21,930 | $2,800 | $19,130 |
| 2019 | $759 | $20,516 | $2,800 | $17,716 |
| 2018 | $707 | $19,102 | $2,800 | $16,302 |
| 2017 | $676 | $18,253 | $2,800 | $15,453 |
| 2016 | $657 | $17,680 | $2,800 | $14,880 |
| 2015 | $620 | $17,680 | $2,800 | $14,880 |
| 2014 | $620 | $17,680 | $2,800 | $14,880 |
Source: Public Records
Map
Nearby Homes
- 11 Blacks Bluff Rd SW
- 529 Branham Ave SW
- 3 Porter St SW
- 25 Blacks Bluff Rd SW
- 515 Hardy Ave SW
- 5 Jervis St SW
- 13 N Blanche Ave SW
- 3 Grover St SW
- 515 Harper Ave SW
- 410 Hardy Ave SW
- 111 Lookout Cir SW
- 107 Butler St SW
- 113 Lookout Cir SW
- 115 Lookout Cir SW
- 316 S McLin St SW
- 515 S Broad St SW
- 334 Branham Ave SW
- 218 Wilson Ave SW
- 110 Cherokee St SW
- 825 S Broad St SW Unit 34
- 825 S Broad St SW
- 819 S Broad St SW
- 815 S Broad St SW
- 827 S Broad St SW
- 0 S Broad St Unit 10177161
- 818 S Broad St SW
- 818 S Broad St SW
- 0 S Broad St Unit 10136579
- 0 S Broad St
- 901 S Broad St SW
- 51 E Glover St SW
- 229 W Glover St SW
- 2 Harbin Alley SW
- 4 Harbin Alley SW
- 903 S Broad St SW
- 905 S Broad St SW
- 4 Pollock St SW
- 816 S Broad St SW
- 900 S Broad St SW