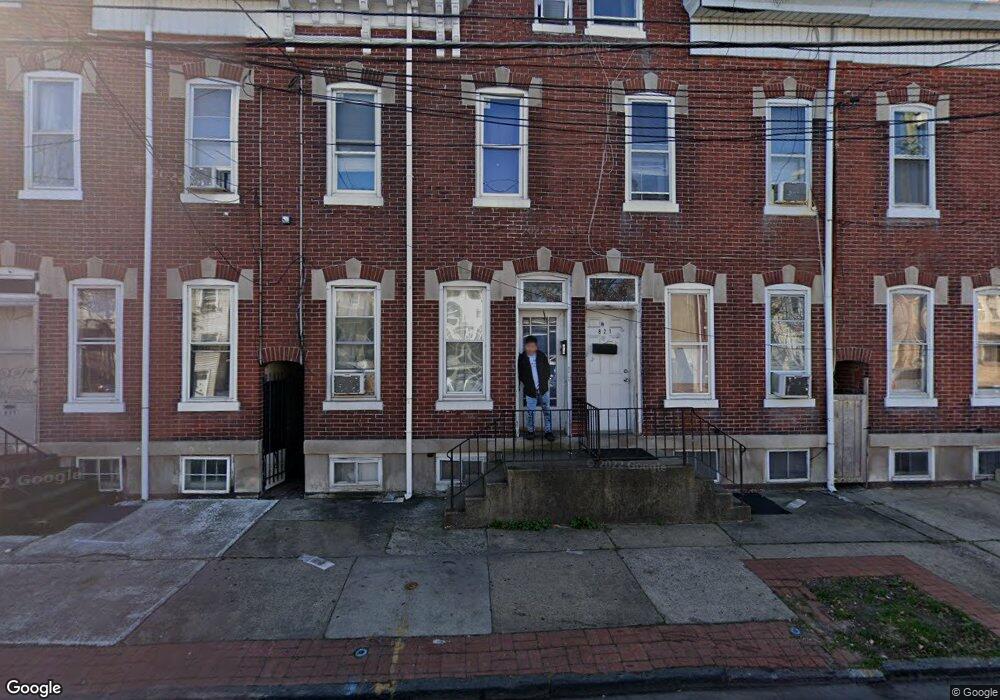
823 S Clinton Ave Trenton, NJ 08611
Chambersburg NeighborhoodEstimated Value: $200,212 - $243,000
3
Beds
1
Bath
1,613
Sq Ft
$141/Sq Ft
Est. Value
About This Home
This home is located at 823 S Clinton Ave, Trenton, NJ 08611 and is currently estimated at $226,803, approximately $140 per square foot. 823 S Clinton Ave is a home located in Mercer County with nearby schools including Robbins Elementary School, Monument Elementary School, and Dr. Crosby Copeland Elementary School.
Ownership History
Date
Name
Owned For
Owner Type
Purchase Details
Closed on
Oct 16, 2018
Sold by
Haonen Llc
Bought by
Rotem Yona Yefet
Current Estimated Value
Purchase Details
Closed on
Jul 24, 2017
Sold by
Ramos Jason and The Clinton 823 South Land Tru
Bought by
Haoren Llc
Purchase Details
Closed on
Apr 5, 2017
Sold by
Khomenko Victor and George Geena Khomenko
Bought by
Pangonis Dorothy and George Geena Komenko
Purchase Details
Closed on
Jan 31, 2011
Sold by
Mcdonnell John M and Wilson Nelson R
Bought by
Khomenko Victor and Khomenko Anya
Home Financials for this Owner
Home Financials are based on the most recent Mortgage that was taken out on this home.
Original Mortgage
$37,500
Interest Rate
4.88%
Mortgage Type
New Conventional
Purchase Details
Closed on
Jan 30, 1996
Sold by
Hud
Bought by
Wilson Nelson
Home Financials for this Owner
Home Financials are based on the most recent Mortgage that was taken out on this home.
Original Mortgage
$34,000
Interest Rate
7.1%
Create a Home Valuation Report for This Property
The Home Valuation Report is an in-depth analysis detailing your home's value as well as a comparison with similar homes in the area
Home Values in the Area
Average Home Value in this Area
Purchase History
| Date | Buyer | Sale Price | Title Company |
|---|---|---|---|
| Rotem Yona Yefet | $73,000 | None Available | |
| Haoren Llc | $48,000 | Sterling Title Agency | |
| Pangonis Dorothy | $36,500 | None Available | |
| Khomenko Victor | $50,000 | Monarch Title Agency Inc | |
| Wilson Nelson | $35,505 | -- |
Source: Public Records
Mortgage History
| Date | Status | Borrower | Loan Amount |
|---|---|---|---|
| Previous Owner | Khomenko Victor | $37,500 | |
| Previous Owner | Wilson Nelson | $34,000 |
Source: Public Records
Tax History Compared to Growth
Tax History
| Year | Tax Paid | Tax Assessment Tax Assessment Total Assessment is a certain percentage of the fair market value that is determined by local assessors to be the total taxable value of land and additions on the property. | Land | Improvement |
|---|---|---|---|---|
| 2025 | $4,014 | $69,200 | $7,100 | $62,100 |
| 2024 | $3,852 | $69,200 | $7,100 | $62,100 |
| 2023 | $3,852 | $69,200 | $7,100 | $62,100 |
| 2022 | $3,777 | $69,200 | $7,100 | $62,100 |
| 2021 | $3,843 | $69,200 | $7,100 | $62,100 |
| 2020 | $3,830 | $69,200 | $7,100 | $62,100 |
| 2019 | $2,794 | $51,300 | $7,100 | $44,200 |
| 2018 | $2,674 | $51,300 | $7,100 | $44,200 |
| 2017 | $2,542 | $51,300 | $7,100 | $44,200 |
| 2016 | $4,056 | $70,500 | $17,500 | $53,000 |
| 2015 | $4,042 | $70,500 | $17,500 | $53,000 |
| 2014 | $4,023 | $70,500 | $17,500 | $53,000 |
Source: Public Records
Map
Nearby Homes
- 826 S Clinton Ave
- 415 Hudson St
- 464 Genesee St
- 407 Hudson St
- 978 S Broad St
- 1081 S Clinton Ave
- 315 Hudson St
- 984 S Broad St
- 113 Hewitt St
- 106 Home Ave
- 131 Hewitt St
- 989 S Broad St
- 122 Butler St
- 617 Beatty St
- 320 Division St
- 239 Butler St
- 724 Division St
- 106 Woodland St
- 150 Ashmore Ave
- 152 Division St
- 825 S Clinton Ave
- 821 S Clinton Ave
- 827 S Clinton Ave
- 819 S Clinton Ave
- 829 S Clinton Ave
- 817 S Clinton Ave
- 831 S Clinton Ave
- 815 S Clinton Ave
- 833 S Clinton Ave
- 813 S Clinton Ave
- 811 S Clinton Ave
- 835 S Clinton Ave
- 809 S Clinton Ave
- 837 S Clinton Ave
- 807 S Clinton Ave
- 839 S Clinton Ave
- 805 S Clinton Ave
- 841 S Clinton Ave Unit B
- 841 S Clinton Ave Unit A
- 841 S Clinton Ave Unit . B