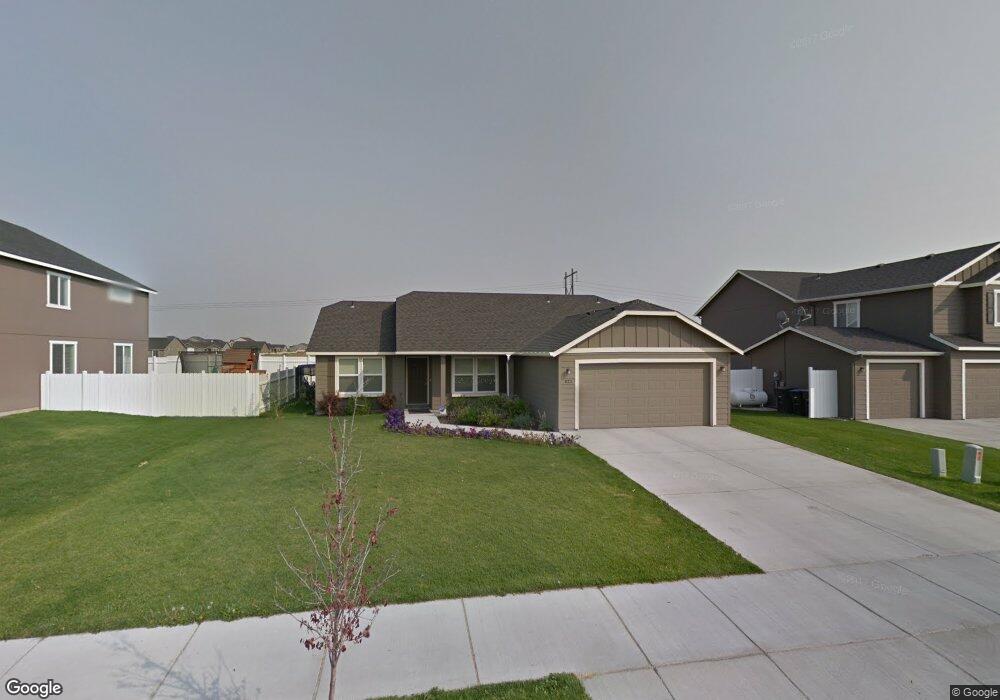
823 S Rees St Moses Lake, WA 98837
Estimated Value: $342,520 - $370,000
3
Beds
2
Baths
1,506
Sq Ft
$240/Sq Ft
Est. Value
About This Home
This home is located at 823 S Rees St, Moses Lake, WA 98837 and is currently estimated at $361,130, approximately $239 per square foot. 823 S Rees St is a home located in Grant County with nearby schools including Lakeview Terrace Elementary School, Columbia Middle School, and Moses Lake High School.
Ownership History
Date
Name
Owned For
Owner Type
Purchase Details
Closed on
May 28, 2020
Sold by
Friehe Carla
Bought by
Bcw Homes Llc
Current Estimated Value
Purchase Details
Closed on
May 15, 2017
Sold by
Friehe Rainis Katharina
Bought by
Friehe Carla
Purchase Details
Closed on
Jan 11, 2012
Sold by
Bowen Catherine Freda and Bowen Maxon Keene
Bought by
Friehe Katharina
Home Financials for this Owner
Home Financials are based on the most recent Mortgage that was taken out on this home.
Original Mortgage
$115,500
Interest Rate
3.93%
Mortgage Type
New Conventional
Purchase Details
Closed on
Oct 31, 2008
Sold by
Hayden Homes Llc
Bought by
Junvik Catherine Freda
Home Financials for this Owner
Home Financials are based on the most recent Mortgage that was taken out on this home.
Original Mortgage
$147,255
Interest Rate
5.77%
Mortgage Type
Purchase Money Mortgage
Create a Home Valuation Report for This Property
The Home Valuation Report is an in-depth analysis detailing your home's value as well as a comparison with similar homes in the area
Home Values in the Area
Average Home Value in this Area
Purchase History
| Date | Buyer | Sale Price | Title Company |
|---|---|---|---|
| Bcw Homes Llc | -- | None Available | |
| Friehe Carla | $154,000 | None Available | |
| Friehe Katharina | $154,000 | Grant County Title | |
| Junvik Catherine Freda | -- | Grant County Title |
Source: Public Records
Mortgage History
| Date | Status | Borrower | Loan Amount |
|---|---|---|---|
| Previous Owner | Friehe Katharina | $115,500 | |
| Previous Owner | Junvik Catherine Freda | $147,255 |
Source: Public Records
Tax History Compared to Growth
Tax History
| Year | Tax Paid | Tax Assessment Tax Assessment Total Assessment is a certain percentage of the fair market value that is determined by local assessors to be the total taxable value of land and additions on the property. | Land | Improvement |
|---|---|---|---|---|
| 2024 | $3,445 | $305,370 | $44,500 | $260,870 |
| 2023 | $2,781 | $219,155 | $32,500 | $186,655 |
| 2022 | $2,623 | $219,155 | $32,500 | $186,655 |
| 2021 | $2,404 | $219,155 | $32,500 | $186,655 |
| 2020 | $2,355 | $193,640 | $32,500 | $161,140 |
| 2019 | $2,295 | $168,495 | $30,000 | $138,495 |
| 2018 | $2,549 | $162,005 | $30,000 | $132,005 |
| 2017 | $2,235 | $152,765 | $30,000 | $122,765 |
| 2016 | $2,150 | $146,420 | $30,000 | $116,420 |
| 2013 | -- | $135,835 | $30,000 | $105,835 |
Source: Public Records
Map
Nearby Homes
- 814 S Blessing St
- 736 S Rees St
- 805 S Hamilton Rd
- 732 N Widgeon St
- 720 N Widgeon St
- 716 N Widgeon St
- 724 N Widgeon
- 728 N Widgeon St
- 700 N Widgeon
- 704 N Widgeon
- 712 N Widgeon
- 1346 Greens Loop
- 800 S Hamilton Rd
- 1055 July Ct
- 1059 July Ct
- 1701 E Burr Ave Unit 51
- 1701 E Burr Ave Unit 67
- 1701 E Burr Ave Unit 12
- 1042 S Lakeland Dr
- 1346 E Oasis Cir