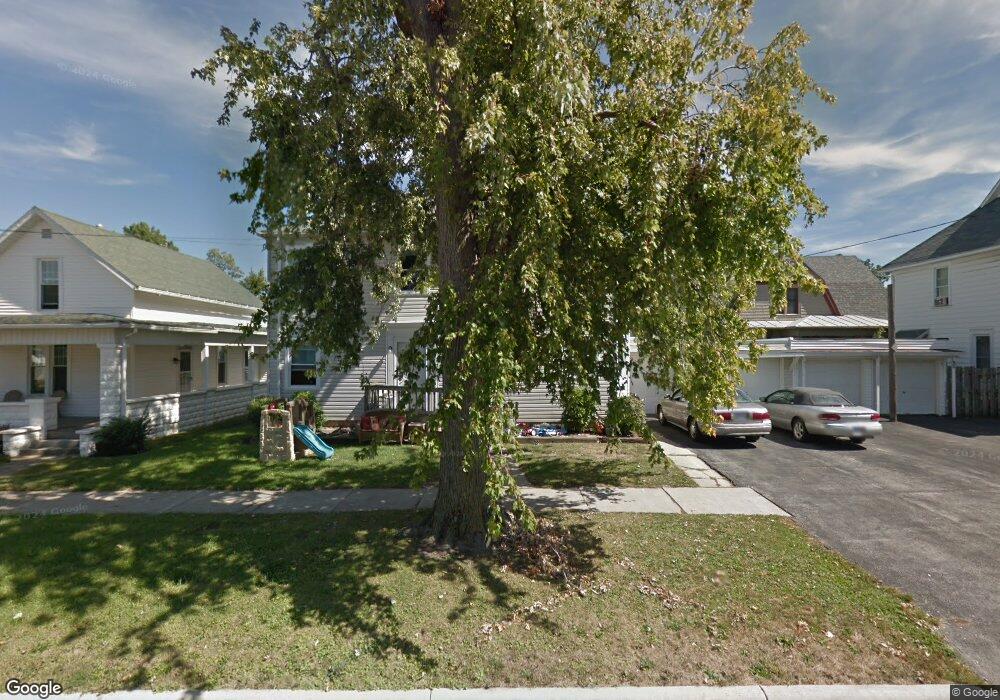
823 S West St Findlay, OH 45840
Estimated Value: $154,067 - $171,000
2
Beds
1
Bath
--
Sq Ft
3,354
Sq Ft Lot
About This Home
This home is located at 823 S West St, Findlay, OH 45840 and is currently estimated at $164,017. 823 S West St is a home located in Hancock County with nearby schools including Lincoln Elementary School, Donnell Middle School, and Findlay High School.
Ownership History
Date
Name
Owned For
Owner Type
Purchase Details
Closed on
Aug 31, 2020
Sold by
Kreinbrink Rodney A and Kreinbrink Heather J
Bought by
Fifty5 Properties Llc
Current Estimated Value
Home Financials for this Owner
Home Financials are based on the most recent Mortgage that was taken out on this home.
Original Mortgage
$89,625
Outstanding Balance
$64,098
Interest Rate
3%
Mortgage Type
Future Advance Clause Open End Mortgage
Estimated Equity
$99,919
Purchase Details
Closed on
Nov 8, 2013
Sold by
Kreinbrink Rodney
Bought by
Kreinbrink Rodney A and Kreinbrink Heather J
Home Financials for this Owner
Home Financials are based on the most recent Mortgage that was taken out on this home.
Original Mortgage
$823,405
Interest Rate
3.32%
Mortgage Type
New Conventional
Purchase Details
Closed on
Jul 15, 1991
Bought by
Syrokosz Donald G
Purchase Details
Closed on
May 15, 1985
Bought by
Jeffery Wanda
Create a Home Valuation Report for This Property
The Home Valuation Report is an in-depth analysis detailing your home's value as well as a comparison with similar homes in the area
Home Values in the Area
Average Home Value in this Area
Purchase History
| Date | Buyer | Sale Price | Title Company |
|---|---|---|---|
| Fifty5 Properties Llc | $119,500 | Golden Key Title Agency | |
| Kreinbrink Rodney A | -- | None Available | |
| Syrokosz Donald G | $50,000 | -- | |
| Jeffery Wanda | -- | -- |
Source: Public Records
Mortgage History
| Date | Status | Borrower | Loan Amount |
|---|---|---|---|
| Open | Fifty5 Properties Llc | $89,625 | |
| Previous Owner | Kreinbrink Rodney A | $823,405 |
Source: Public Records
Tax History Compared to Growth
Tax History
| Year | Tax Paid | Tax Assessment Tax Assessment Total Assessment is a certain percentage of the fair market value that is determined by local assessors to be the total taxable value of land and additions on the property. | Land | Improvement |
|---|---|---|---|---|
| 2024 | $1,569 | $43,050 | $4,080 | $38,970 |
| 2023 | $1,572 | $43,050 | $4,080 | $38,970 |
| 2022 | $1,566 | $43,050 | $4,080 | $38,970 |
| 2021 | $1,203 | $28,800 | $4,190 | $24,610 |
| 2020 | $1,203 | $28,800 | $4,190 | $24,610 |
| 2019 | $1,179 | $28,800 | $4,190 | $24,610 |
| 2018 | $1,034 | $23,180 | $3,350 | $19,830 |
| 2017 | $517 | $23,180 | $3,350 | $19,830 |
| 2016 | $1,031 | $23,180 | $3,350 | $19,830 |
| 2015 | $1,149 | $25,540 | $3,750 | $21,790 |
| 2014 | $1,149 | $25,540 | $3,750 | $21,790 |
| 2012 | $1,528 | $33,730 | $3,750 | $29,980 |
Source: Public Records
Map
Nearby Homes
- 905 S West St
- 225 Lima Ave
- 720 S West St
- 412 Lima Ave
- 416 1/2 Lima Ave
- 419 W Lincoln St
- 1115 Liberty St
- 527 W Lincoln St
- 202 Hancock St
- 514 Liberty St
- 829 Maple Ave
- 420 1st St
- 123 Glendale Ave
- 801 W Sandusky St
- 817 Park St
- 1421 Hurd Ave
- 1109 Park St
- 407 Washington St
- 210 Western Ave
- 915 W Main Cross St