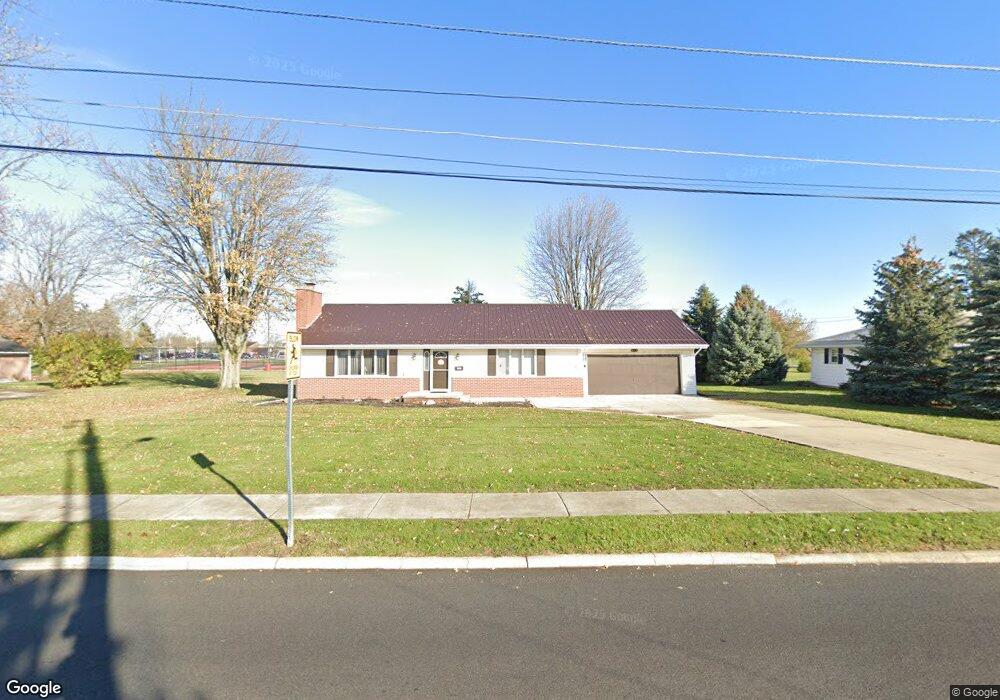
823 Summit St Kenton, OH 43326
Estimated Value: $157,236 - $253,000
2
Beds
2
Baths
1,408
Sq Ft
$136/Sq Ft
Est. Value
About This Home
This home is located at 823 Summit St, Kenton, OH 43326 and is currently estimated at $191,059, approximately $135 per square foot. 823 Summit St is a home located in Hardin County with nearby schools including Kenton Elementary School, Kenton Middle School, and Kenton High School.
Ownership History
Date
Name
Owned For
Owner Type
Purchase Details
Closed on
Oct 7, 2013
Sold by
Musselman Jason M and Musselman Lura D
Bought by
Brenner Jim A and Brenner Rosalyn
Current Estimated Value
Purchase Details
Closed on
Jul 20, 2009
Sold by
Wilson Betty L
Bought by
Musselman Jason M and Musselman Lura D
Home Financials for this Owner
Home Financials are based on the most recent Mortgage that was taken out on this home.
Original Mortgage
$68,700
Interest Rate
5.32%
Mortgage Type
New Conventional
Create a Home Valuation Report for This Property
The Home Valuation Report is an in-depth analysis detailing your home's value as well as a comparison with similar homes in the area
Home Values in the Area
Average Home Value in this Area
Purchase History
| Date | Buyer | Sale Price | Title Company |
|---|---|---|---|
| Brenner Jim A | $110,000 | None Available | |
| Musselman Jason M | $85,900 | None Available |
Source: Public Records
Mortgage History
| Date | Status | Borrower | Loan Amount |
|---|---|---|---|
| Previous Owner | Musselman Jason M | $68,700 |
Source: Public Records
Tax History
| Year | Tax Paid | Tax Assessment Tax Assessment Total Assessment is a certain percentage of the fair market value that is determined by local assessors to be the total taxable value of land and additions on the property. | Land | Improvement |
|---|---|---|---|---|
| 2024 | $1,511 | $44,780 | $5,430 | $39,350 |
| 2023 | $1,533 | $44,780 | $5,430 | $39,350 |
| 2022 | $1,456 | $39,720 | $4,080 | $35,640 |
| 2021 | $1,461 | $39,720 | $4,080 | $35,640 |
| 2020 | $1,270 | $39,720 | $4,080 | $35,640 |
| 2019 | $977 | $33,050 | $3,890 | $29,160 |
| 2018 | $980 | $33,050 | $3,890 | $29,160 |
| 2017 | $932 | $33,050 | $3,890 | $29,160 |
| 2016 | $904 | $29,340 | $5,530 | $23,810 |
| 2015 | $1,054 | $29,340 | $5,530 | $23,810 |
| 2014 | $787 | $29,340 | $5,530 | $23,810 |
| 2013 | $256 | $28,460 | $5,530 | $22,930 |
Source: Public Records
Map
Nearby Homes
- 619 E North St
- 89 Broadway St
- 79 Broadway St
- 509 E North St
- 120 Oak Ln Unit 7
- 0 N Barron St Unit Lot 6
- 0 N Barron St Unit Lot 8
- 0 N Barron St Unit Lot 3
- 0 N Barron St Unit Lot 2
- 0 N Barron St Unit Lot 4
- 503 Jennings St Unit Lot 7
- 0 Gilmore St Unit Lot 9
- 0 Gilmore St Unit Lot 10
- 39 Grape St
- 416 E Eliza St Unit Lot 1
- 411 E Eliza St
- 405 E Carrol St Unit 405 1/2
- 405 E Carroll St
- 530 E Franklin St
- 820 King St
Your Personal Tour Guide
Ask me questions while you tour the home.