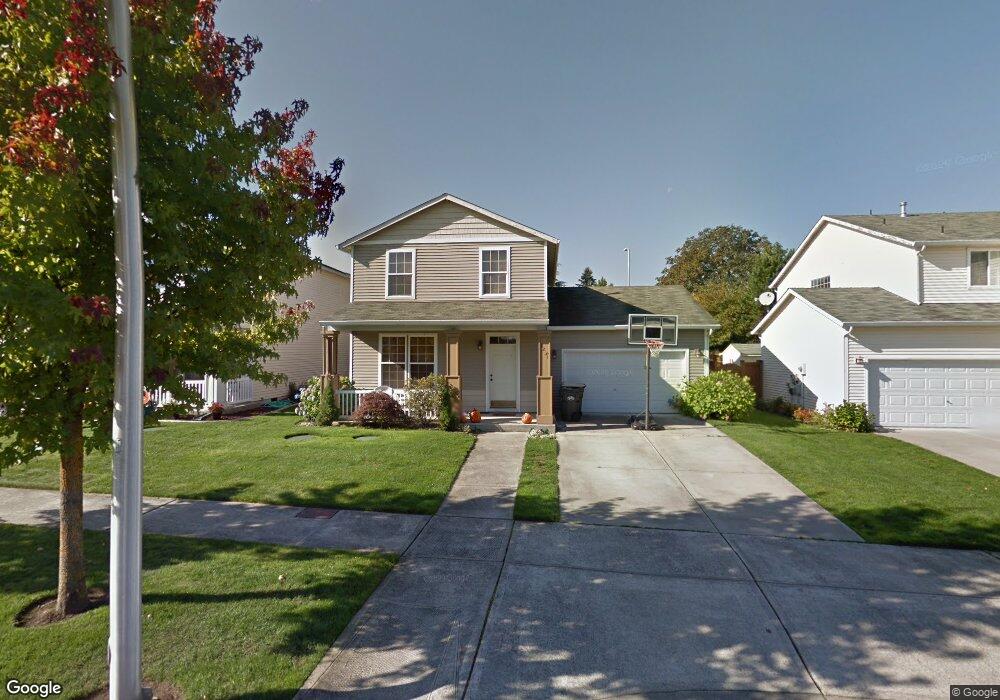
8231 Sweetbrier Loop SE Olympia, WA 98513
Meadows NeighborhoodEstimated Value: $446,000 - $475,000
3
Beds
3
Baths
1,481
Sq Ft
$309/Sq Ft
Est. Value
About This Home
This home is located at 8231 Sweetbrier Loop SE, Olympia, WA 98513 and is currently estimated at $457,617, approximately $308 per square foot. 8231 Sweetbrier Loop SE is a home located in Thurston County with nearby schools including Evergreen Forest Elementary School, Nisqually Middle School, and River Ridge High School.
Ownership History
Date
Name
Owned For
Owner Type
Purchase Details
Closed on
Jun 20, 2015
Sold by
Willingham James E and Willingham Kendra N
Bought by
Willingham James E and Willingham Kendra N
Current Estimated Value
Home Financials for this Owner
Home Financials are based on the most recent Mortgage that was taken out on this home.
Original Mortgage
$213,515
Outstanding Balance
$163,476
Interest Rate
3.75%
Mortgage Type
FHA
Estimated Equity
$294,141
Purchase Details
Closed on
May 25, 2001
Sold by
Aho Construction I Inc
Bought by
Willingham James E and Willingham Kendra M
Home Financials for this Owner
Home Financials are based on the most recent Mortgage that was taken out on this home.
Original Mortgage
$144,827
Interest Rate
7.15%
Mortgage Type
FHA
Purchase Details
Closed on
Jan 24, 2001
Sold by
Aho Construction Llc
Bought by
Aho Construction I Inc
Create a Home Valuation Report for This Property
The Home Valuation Report is an in-depth analysis detailing your home's value as well as a comparison with similar homes in the area
Home Values in the Area
Average Home Value in this Area
Purchase History
| Date | Buyer | Sale Price | Title Company |
|---|---|---|---|
| Willingham James E | -- | Nextitle | |
| Willingham James E | $147,100 | Charter Title Corporation | |
| Aho Construction I Inc | -- | -- |
Source: Public Records
Mortgage History
| Date | Status | Borrower | Loan Amount |
|---|---|---|---|
| Open | Willingham James E | $213,515 | |
| Closed | Willingham James E | $144,827 |
Source: Public Records
Tax History
| Year | Tax Paid | Tax Assessment Tax Assessment Total Assessment is a certain percentage of the fair market value that is determined by local assessors to be the total taxable value of land and additions on the property. | Land | Improvement |
|---|---|---|---|---|
| 2025 | $3,768 | $411,600 | $135,300 | $276,300 |
| 2024 | $3,768 | $399,000 | $130,100 | $268,900 |
| 2023 | $3,768 | $383,500 | $108,800 | $274,700 |
| 2022 | $3,559 | $352,800 | $66,200 | $286,600 |
| 2021 | $3,190 | $296,600 | $73,100 | $223,500 |
| 2020 | $2,935 | $247,100 | $68,800 | $178,300 |
| 2019 | $2,488 | $233,600 | $60,500 | $173,100 |
| 2018 | $2,792 | $198,400 | $44,900 | $153,500 |
| 2017 | $2,651 | $196,100 | $43,700 | $152,400 |
| 2016 | -- | $187,150 | $44,150 | $143,000 |
| 2014 | -- | $180,450 | $44,150 | $136,300 |
Source: Public Records
Map
Nearby Homes
- 8324 Sweetbrier Loop SE
- 1525 Greenway Ln SE
- 8138 18th Ln SE
- 8433 Sweetbrier Loop SE
- 8124 18th Ln SE Unit 142
- 8437 16th Ave SE
- 1823 Cranberry Ln SE
- 1528 Farina Loop SE
- 1948 Cranberry Ln SE Unit 75
- 8118 20th Ln SE Unit 93
- 1546 Farina Loop SE
- 8018 18th Ln SE
- 2149 Pleasanton Ct SE
- 8632 Graham Dr SE
- 7829 21st Ln SE
- 2544 Marvin Rd SE
- 2538 Hidden Springs Loop SE
- 2602 Marvin Rd SE
- 8727 Pacific Ave SE
- 7917 25th Ave SE
- 8229 Sweetbrier Loop SE
- 8233 Sweetbrier Loop SE
- 8203 16th Ave SE
- 8227 Sweetbrier Loop SE
- 8302 16th Ave SE
- 8225 Sweetbrier Loop SE
- 8237 Sweetbrier Loop SE
- 8303 16th Ave SE
- 8308 16th Ave SE
- 8309 16th Ave SE
- 8239 Sweetbrier Loop SE
- 8223 Sweetbrier Loop SE
- 8314 16th Ave SE
- 8303 15th Ave SE
- 8304 Sweetbrier Loop SE
- 8317 16th Ave SE
- 8307 15th Ave SE
- 8241 Sweetbrier Loop SE
- 8308 Sweetbrier Loop SE
- 8323 16th Ave SE
Your Personal Tour Guide
Ask me questions while you tour the home.