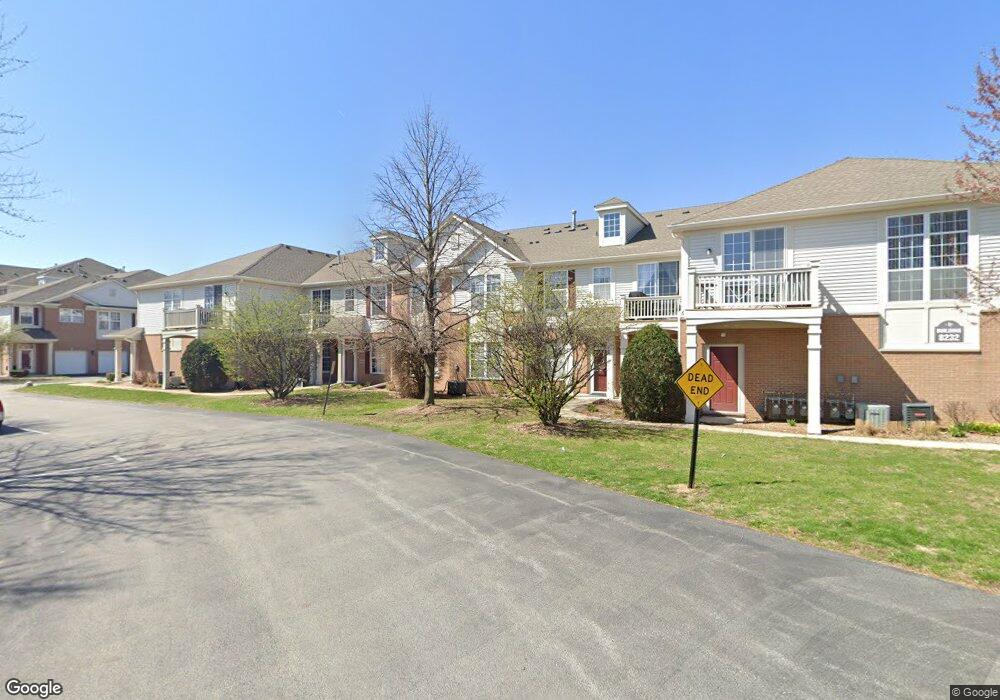
8232 Concord Ln Unit H Justice, IL 60458
Estimated Value: $226,000 - $252,000
2
Beds
2
Baths
1,300
Sq Ft
$187/Sq Ft
Est. Value
About This Home
This home is located at 8232 Concord Ln Unit H, Justice, IL 60458 and is currently estimated at $243,430, approximately $187 per square foot. 8232 Concord Ln Unit H is a home located in Cook County with nearby schools including Frank A Brodnicki Elementary School, Argo Community High School, and St. Patricia School.
Ownership History
Date
Name
Owned For
Owner Type
Purchase Details
Closed on
Jun 16, 2014
Sold by
Fannie Mae
Bought by
Milenkovic Ivana and Milicevic Milan
Current Estimated Value
Home Financials for this Owner
Home Financials are based on the most recent Mortgage that was taken out on this home.
Original Mortgage
$96,000
Outstanding Balance
$74,501
Interest Rate
4.75%
Mortgage Type
New Conventional
Estimated Equity
$168,929
Purchase Details
Closed on
Apr 1, 2014
Sold by
Trekles Joy M
Bought by
Federal National Mortgage Association
Purchase Details
Closed on
Nov 1, 2003
Sold by
Asbury Woods Llc
Bought by
Trekles Joy M
Home Financials for this Owner
Home Financials are based on the most recent Mortgage that was taken out on this home.
Original Mortgage
$117,523
Interest Rate
5.91%
Mortgage Type
FHA
Create a Home Valuation Report for This Property
The Home Valuation Report is an in-depth analysis detailing your home's value as well as a comparison with similar homes in the area
Home Values in the Area
Average Home Value in this Area
Purchase History
| Date | Buyer | Sale Price | Title Company |
|---|---|---|---|
| Milenkovic Ivana | -- | Premier Title Company | |
| Federal National Mortgage Association | -- | Premier Title | |
| Trekles Joy M | $179,500 | Cti |
Source: Public Records
Mortgage History
| Date | Status | Borrower | Loan Amount |
|---|---|---|---|
| Open | Milenkovic Ivana | $96,000 | |
| Previous Owner | Trekles Joy M | $117,523 |
Source: Public Records
Tax History Compared to Growth
Tax History
| Year | Tax Paid | Tax Assessment Tax Assessment Total Assessment is a certain percentage of the fair market value that is determined by local assessors to be the total taxable value of land and additions on the property. | Land | Improvement |
|---|---|---|---|---|
| 2024 | $3,984 | $16,193 | $1,315 | $14,878 |
| 2023 | $3,636 | $16,193 | $1,315 | $14,878 |
| 2022 | $3,636 | $13,534 | $2,703 | $10,831 |
| 2021 | $3,490 | $13,533 | $2,703 | $10,830 |
| 2020 | $3,446 | $13,533 | $2,703 | $10,830 |
| 2019 | $2,758 | $11,045 | $2,483 | $8,562 |
| 2018 | $2,634 | $11,045 | $2,483 | $8,562 |
| 2017 | $2,631 | $11,045 | $2,483 | $8,562 |
| 2016 | $2,912 | $10,495 | $2,191 | $8,304 |
| 2015 | $3,739 | $10,495 | $2,191 | $8,304 |
| 2014 | $2,772 | $10,495 | $2,191 | $8,304 |
| 2013 | $2,369 | $10,001 | $2,191 | $7,810 |
Source: Public Records
Map
Nearby Homes
- 8232 Concord Ln Unit 6B720
- 8217 Concord Ln Unit B
- 8830 Concord Ln Unit 20C723
- 8947 W 83rd St
- 8121 Concord Ln Unit J
- 8108 Concord Ln Unit K
- 8036 Fawn Trail
- 7850 Garden Ln
- 7330 S 86th Ave
- 7816 Blazer Ave
- 9141 Meadowview Dr
- 8948 Barberry Ln
- 9049 Barberry Ln
- 8701 S Kean Ave
- 9101 Sycamore Dr
- 7700 Garden Ln
- 7716 Cronin Ave
- 7912 S 85th Ave
- 8851 W 76th Place
- Lot 8 S Kean Ave
- 8232 Concord Ln Unit 6A720
- 8232 Concord Ln Unit 6B722
- 8232 Concord Ln Unit 6B721
- 8232 Concord Ln Unit 6D722
- 8232 Concord Ln Unit 6C722
- 8232 Concord Ln Unit 6A722
- 8232 Concord Ln Unit 6D721
- 8232 Concord Ln Unit 6C721
- 8232 Concord Ln Unit 6A721
- 8232 Concord Ln Unit 6D720
- 8232 Concord Ln Unit 6C720
- 8232 Concord Ln Unit I
- 8232 Concord Ln Unit K
- 8232 Concord Ln Unit A
- 8232 Concord Ln Unit C
- 8232 Concord Ln Unit H
- 8232 Concord Ln Unit E
- 8225 Concord Ln Unit A
- 8225 Concord Ln Unit G
- 8225 Concord Ln Unit L