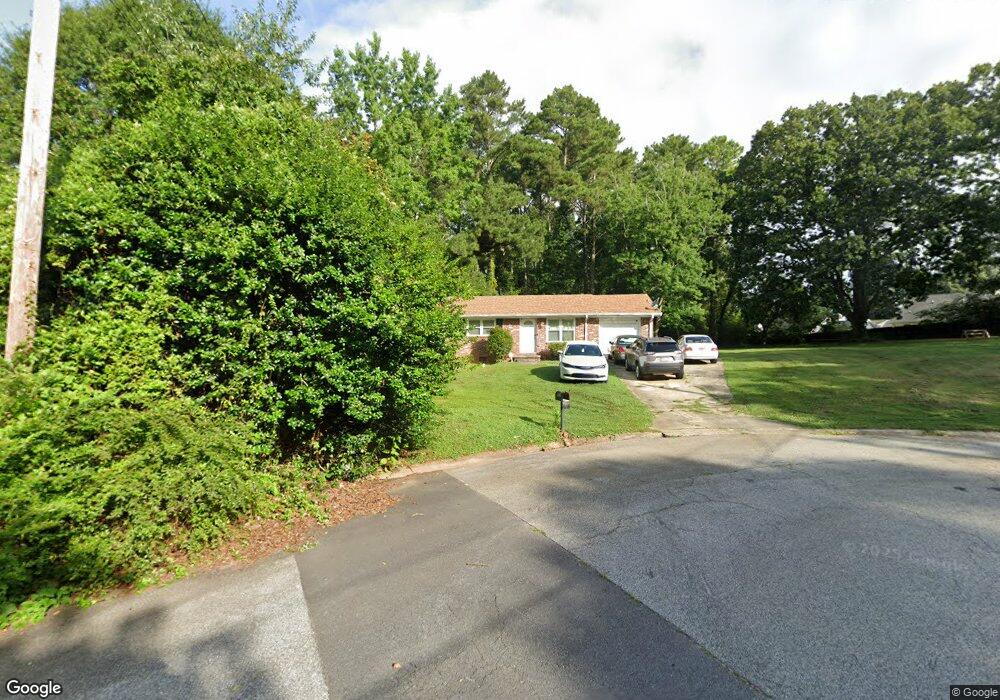
8233 Dixon Ct Unit 1 Jonesboro, GA 30238
Estimated Value: $179,523 - $193,000
2
Beds
2
Baths
1,026
Sq Ft
$180/Sq Ft
Est. Value
About This Home
This home is located at 8233 Dixon Ct Unit 1, Jonesboro, GA 30238 and is currently estimated at $184,631, approximately $179 per square foot. 8233 Dixon Ct Unit 1 is a home located in Clayton County with nearby schools including Lee Street Elementary School, Jonesboro Middle School, and Jonesboro High School.
Ownership History
Date
Name
Owned For
Owner Type
Purchase Details
Closed on
Apr 1, 2024
Sold by
Buckner Rhonda Lea
Bought by
Green Kevin Alex and Lewis Shamika Tonietta
Current Estimated Value
Purchase Details
Closed on
Dec 14, 2017
Sold by
Ballard Richard W
Bought by
Howard Cynthia Rhea and Buckner Rhonda Lea
Purchase Details
Closed on
Mar 3, 2014
Sold by
Hand Byron W
Bought by
Howard Cynthia Rhea and Buckner Rhonda Lea
Purchase Details
Closed on
Jun 7, 2011
Sold by
Cannon Mary T
Bought by
Hand Byron W
Purchase Details
Closed on
Sep 8, 1999
Sold by
Harbin Connie J
Bought by
Cannon Mary T
Home Financials for this Owner
Home Financials are based on the most recent Mortgage that was taken out on this home.
Original Mortgage
$57,000
Interest Rate
7.73%
Mortgage Type
New Conventional
Purchase Details
Closed on
Aug 23, 1995
Sold by
Medlin Wayne D
Bought by
Harbin Connie J
Create a Home Valuation Report for This Property
The Home Valuation Report is an in-depth analysis detailing your home's value as well as a comparison with similar homes in the area
Home Values in the Area
Average Home Value in this Area
Purchase History
| Date | Buyer | Sale Price | Title Company |
|---|---|---|---|
| Green Kevin Alex | $150,000 | -- | |
| Howard Cynthia Rhea | -- | -- | |
| Howard Cynthia Rhea | $50,000 | -- | |
| Hand Byron W | $47,643 | -- | |
| Cannon Mary T | $65,000 | -- | |
| Harbin Connie J | $58,000 | -- |
Source: Public Records
Mortgage History
| Date | Status | Borrower | Loan Amount |
|---|---|---|---|
| Previous Owner | Cannon Mary T | $57,000 |
Source: Public Records
Tax History Compared to Growth
Tax History
| Year | Tax Paid | Tax Assessment Tax Assessment Total Assessment is a certain percentage of the fair market value that is determined by local assessors to be the total taxable value of land and additions on the property. | Land | Improvement |
|---|---|---|---|---|
| 2024 | $2,048 | $51,600 | $6,400 | $45,200 |
| 2023 | $1,813 | $50,200 | $6,400 | $43,800 |
| 2022 | $0 | $38,800 | $6,400 | $32,400 |
| 2021 | $841 | $20,400 | $5,600 | $14,800 |
| 2020 | $729 | $20,400 | $5,600 | $14,800 |
| 2019 | $863 | $20,400 | $5,600 | $14,800 |
| 2018 | $279 | $6,000 | $5,600 | $400 |
| 2017 | $279 | $6,000 | $5,600 | $400 |
| 2016 | $279 | $14,400 | $5,600 | $8,800 |
| 2015 | $248 | $0 | $0 | $0 |
| 2014 | $574 | $13,560 | $5,600 | $7,960 |
Source: Public Records
Map
Nearby Homes
- 602 Dixon Rd
- 729 Winter Ln
- 8474 Magnolia Dr
- 8431 Magnolia Dr
- 636 North Ave Unit 3H
- 636 North Ave Unit 5A
- 636 North Ave Unit 11A
- 626 Sycamore Dr
- 8469 Shiloh Ct
- 570 Sycamore Dr
- 8506 Kaden Dr
- 139 North Ave
- 761 Robert e Lee Pkwy
- 181 Dean St
- 135 N Main St
- 9758 Highway 54
- 7994 Devonshire Dr
- 556 Maggie Ln
- 8236 Tudor Dr
- 687 Utoy Ct
- 8230 Dixon Ct
- 8231 Dixon Ct
- 716 Dixon Rd
- 724 Dixon Rd
- 0 Dixon Ct
- 721 Hynds Springs Dr
- 727 Hynds Springs Dr
- 715 Hynds Springs Dr
- 708 Dixon Rd
- 733 Hynds Springs Dr
- 709 Hynds Springs Dr
- 702 Dixon Rd
- 739 Hynds Springs Dr
- 703 Hynds Springs Dr
- 746 Dixon Rd
- 8234 Dixon Ct
- 0 Hynds Springs Dr Unit 7158463
- 0 Hynds Springs Dr Unit 7044355
- 0 Hynds Springs Dr Unit 8601402
- 0 Hynds Springs Dr Unit 8822917