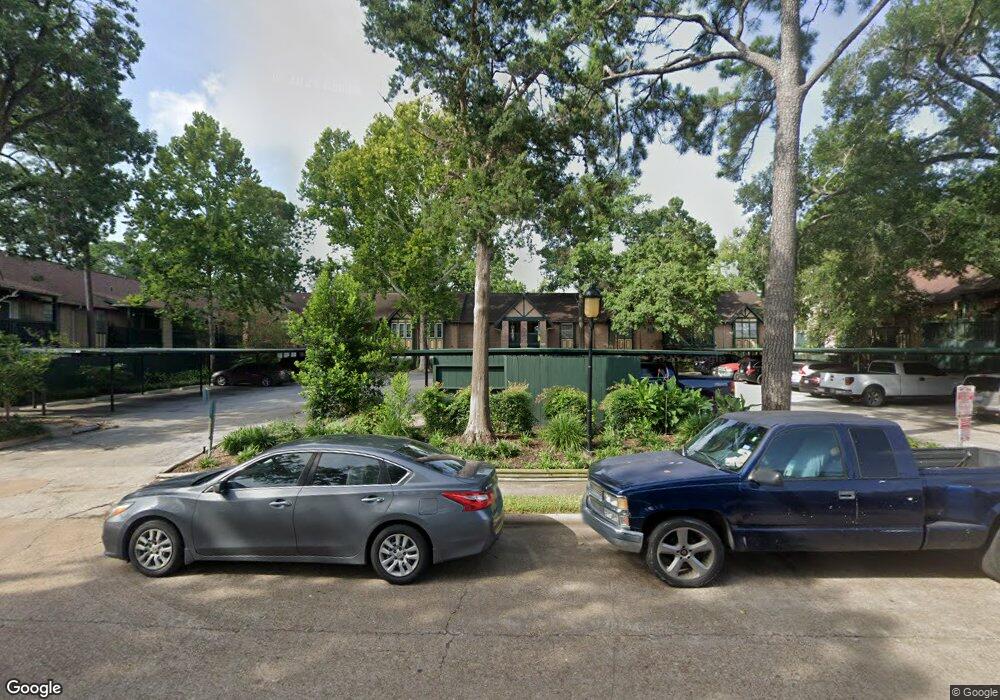
8233 Kingsbrook Rd Unit 133 Houston, TX 77024
Uptown-Galleria District NeighborhoodEstimated Value: $110,000 - $130,547
1
Bed
1
Bath
800
Sq Ft
$155/Sq Ft
Est. Value
About This Home
This home is located at 8233 Kingsbrook Rd Unit 133, Houston, TX 77024 and is currently estimated at $123,637, approximately $154 per square foot. 8233 Kingsbrook Rd Unit 133 is a home located in Harris County with nearby schools including Hunters Creek Elementary School, Spring Branch Middle School, and Memorial High School.
Ownership History
Date
Name
Owned For
Owner Type
Purchase Details
Closed on
Mar 11, 2019
Sold by
Snelling Tina
Bought by
Blifford Sharon
Current Estimated Value
Purchase Details
Closed on
Sep 13, 2006
Sold by
Hathaway Rebecca G
Bought by
Hathaway Deborah
Home Financials for this Owner
Home Financials are based on the most recent Mortgage that was taken out on this home.
Original Mortgage
$88,000
Interest Rate
6.51%
Mortgage Type
Stand Alone First
Purchase Details
Closed on
Aug 16, 2002
Sold by
Jolom Properties Llc
Bought by
Niemann Russell
Home Financials for this Owner
Home Financials are based on the most recent Mortgage that was taken out on this home.
Original Mortgage
$58,567
Interest Rate
6.48%
Purchase Details
Closed on
Jun 28, 2002
Sold by
Hodas Herbert J and Hodas Deborah
Bought by
Ausucua Adrian
Home Financials for this Owner
Home Financials are based on the most recent Mortgage that was taken out on this home.
Original Mortgage
$58,567
Interest Rate
6.48%
Create a Home Valuation Report for This Property
The Home Valuation Report is an in-depth analysis detailing your home's value as well as a comparison with similar homes in the area
Home Values in the Area
Average Home Value in this Area
Purchase History
| Date | Buyer | Sale Price | Title Company |
|---|---|---|---|
| Blifford Sharon | -- | None Available | |
| Hathaway Deborah | -- | Richmond Title Services Lp | |
| Niemann Russell | -- | North American Title Co | |
| Ausucua Adrian | -- | North American Title Co |
Source: Public Records
Mortgage History
| Date | Status | Borrower | Loan Amount |
|---|---|---|---|
| Previous Owner | Hathaway Deborah | $88,000 | |
| Previous Owner | Niemann Russell | $58,567 | |
| Previous Owner | Ausucua Adrian | $48,925 |
Source: Public Records
Tax History Compared to Growth
Tax History
| Year | Tax Paid | Tax Assessment Tax Assessment Total Assessment is a certain percentage of the fair market value that is determined by local assessors to be the total taxable value of land and additions on the property. | Land | Improvement |
|---|---|---|---|---|
| 2025 | $2,935 | $133,146 | $25,298 | $107,848 |
| 2024 | $2,935 | $133,146 | $25,298 | $107,848 |
| 2023 | $2,935 | $117,601 | $22,344 | $95,257 |
| 2022 | $2,685 | $114,829 | $21,818 | $93,011 |
| 2021 | $2,711 | $111,040 | $21,098 | $89,942 |
| 2020 | $2,782 | $111,040 | $21,098 | $89,942 |
| 2019 | $2,907 | $111,040 | $21,098 | $89,942 |
| 2018 | $1,296 | $105,937 | $20,128 | $85,809 |
| 2017 | $2,771 | $105,937 | $20,128 | $85,809 |
| 2016 | $3,274 | $125,155 | $23,779 | $101,376 |
| 2015 | $2,342 | $101,310 | $19,249 | $82,061 |
| 2014 | $2,342 | $88,000 | $18,125 | $69,875 |
Source: Public Records
Map
Nearby Homes
- 8229 Kingsbrook Rd Unit 228
- 8229 Kingsbrook Rd Unit 229
- 8223 Kingsbrook Rd Unit 212
- 8277 Kingsbrook Rd Unit 254
- 8287 Kingsbrook Rd Unit 268
- 210 Park Laureate Dr
- 8211 Katy Fwy Unit 42
- 8211 Katy Fwy Unit 23
- 130 Park Laureate Dr
- 750 E Creekside Dr
- 601 Lindenwood Dr
- 764 Kuhlman Rd
- 7807 Bryonwood Dr
- 10426 Memorial Dr
- 1115 Glourie Dr
- 1114 Guinea Dr
- 728 Highgrove Park
- 736 Highgrove Park
- 7603 Edgeway Dr
- 86 S Creekside Ct
- 8233 Kingsbrook Rd Unit 233
- 8233 Kingsbrook Rd Unit 132
- 8233 Kingsbrook Rd Unit 235
- 8233 Kingsbrook Rd Unit 234
- 8233 Kingsbrook Rd Unit 232
- 8233 Kingsbrook Rd Unit 135
- 8233 Kingsbrook Rd Unit 131
- 8233 Kingsbrook Rd Unit 130
- 8227 Kingsbrook Rd Unit 120
- 8227 Kingsbrook Rd Unit 223
- 8227 Kingsbrook Rd Unit 222
- 8227 Kingsbrook Rd Unit 221
- 8227 Kingsbrook Rd Unit 220
- 8227 Kingsbrook Rd Unit 123
- 8227 Kingsbrook Rd Unit 122
- 8227 Kingsbrook Rd Unit 121
- 8227 Kingsbrook Rd
- 8229 Kingsbrook Rd Unit 129
- 8229 Kingsbrook Rd Unit 224
- 8229 Kingsbrook Rd Unit 127