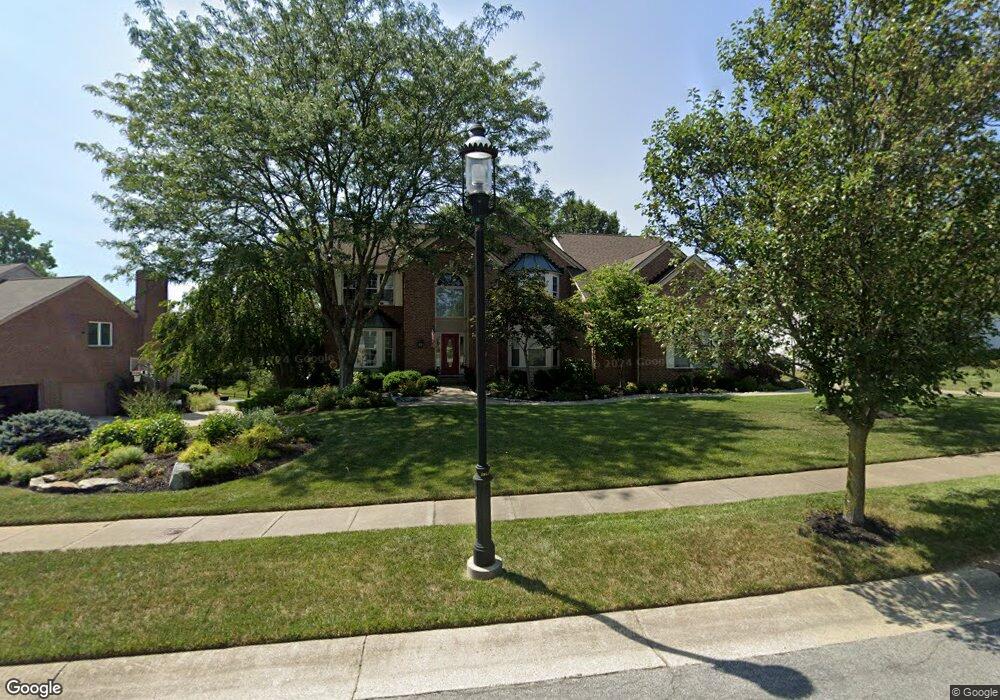
8233 Little Harbor Dr Cincinnati, OH 45244
Dry Run NeighborhoodEstimated Value: $839,570 - $1,173,000
5
Beds
5
Baths
5,345
Sq Ft
$185/Sq Ft
Est. Value
About This Home
This home is located at 8233 Little Harbor Dr, Cincinnati, OH 45244 and is currently estimated at $990,393, approximately $185 per square foot. 8233 Little Harbor Dr is a home located in Hamilton County with nearby schools including Wilson Elementary School, Nagel Middle School, and Turpin High School.
Ownership History
Date
Name
Owned For
Owner Type
Purchase Details
Closed on
Dec 30, 2000
Sold by
Worley Douglas E and Worley Tamara L
Bought by
Reifsnyder Robert C and Reifsnyder Gretchen H
Current Estimated Value
Purchase Details
Closed on
Nov 23, 1999
Sold by
Orner Dan R
Bought by
Worley Douglas E and Worley Tamara L
Home Financials for this Owner
Home Financials are based on the most recent Mortgage that was taken out on this home.
Original Mortgage
$388,000
Interest Rate
6.87%
Purchase Details
Closed on
Nov 15, 1999
Sold by
The Landings At Anderson Ltd
Bought by
Orner Dan R
Home Financials for this Owner
Home Financials are based on the most recent Mortgage that was taken out on this home.
Original Mortgage
$388,000
Interest Rate
6.87%
Create a Home Valuation Report for This Property
The Home Valuation Report is an in-depth analysis detailing your home's value as well as a comparison with similar homes in the area
Home Values in the Area
Average Home Value in this Area
Purchase History
| Date | Buyer | Sale Price | Title Company |
|---|---|---|---|
| Reifsnyder Robert C | $495,000 | -- | |
| Worley Douglas E | -- | First Title Agency Inc | |
| Orner Dan R | $486,500 | First Title Agency Inc |
Source: Public Records
Mortgage History
| Date | Status | Borrower | Loan Amount |
|---|---|---|---|
| Previous Owner | Worley Douglas E | $388,000 | |
| Closed | Worley Douglas E | $48,500 |
Source: Public Records
Tax History Compared to Growth
Tax History
| Year | Tax Paid | Tax Assessment Tax Assessment Total Assessment is a certain percentage of the fair market value that is determined by local assessors to be the total taxable value of land and additions on the property. | Land | Improvement |
|---|---|---|---|---|
| 2024 | $14,199 | $231,578 | $31,080 | $200,498 |
| 2023 | $13,512 | $231,578 | $31,080 | $200,498 |
| 2022 | $12,364 | $189,925 | $28,081 | $161,844 |
| 2021 | $12,072 | $189,925 | $28,081 | $161,844 |
| 2020 | $12,255 | $189,925 | $28,081 | $161,844 |
| 2019 | $11,947 | $168,074 | $24,850 | $143,224 |
| 2018 | $11,197 | $168,074 | $24,850 | $143,224 |
| 2017 | $10,565 | $168,074 | $24,850 | $143,224 |
| 2016 | $10,802 | $167,945 | $25,463 | $142,482 |
| 2015 | $10,494 | $167,945 | $25,463 | $142,482 |
| 2014 | $10,501 | $167,945 | $25,463 | $142,482 |
| 2013 | $10,238 | $173,138 | $26,250 | $146,888 |
Source: Public Records
Map
Nearby Homes
- 2161 Knightsbridge Dr
- 2623 8 Mile Rd
- 2193 Forestlake Dr
- 2067 Knightsbridge Dr
- 8032 Lancelot Dr
- 8146 Clough Pike
- 2083 Forestcrest Way
- 7652 Clough Pike
- L Clough Pike
- 2547 Teuton Ct
- 4383 Wiborg Dr
- 2051 Tall Pines Ln
- 1847 Eight Mile Rd
- 464 Glenrose Ln
- 465 Glenrose Ln
- 8413 Summitridge Dr
- 1747 Summithills Dr
- 1682 Yellowglen Dr
- 445 Ivy Trails Dr
- 8385 Bridle Rd
- 8215 Little Harbor Dr
- 8241 Little Harbor Dr
- 65 Little Harbor Dr Unit 65
- 50 Little Harbor Dr Unit 50
- 8249 Little Harbor Dr
- 8207 Little Harbor Dr
- 2314 Shimmering Bay Ln
- 2306 Shimmering Bay Ln
- 8311 Katies Ct
- 8308 Katies Ct
- 2356 Shimmering Bay Ln
- 2300 Shimmering Bay Ln
- 8210 Little Harbor Dr
- 8257 Little Harbor Dr
- 2320 Shimmering Bay Ln
- 8242 Little Harbor Dr
- 8248 Little Harbor Dr
- 2290 Shimmering Bay Ln
- 2390 Shimmering Bay Ln
- 8317 Katies Ct