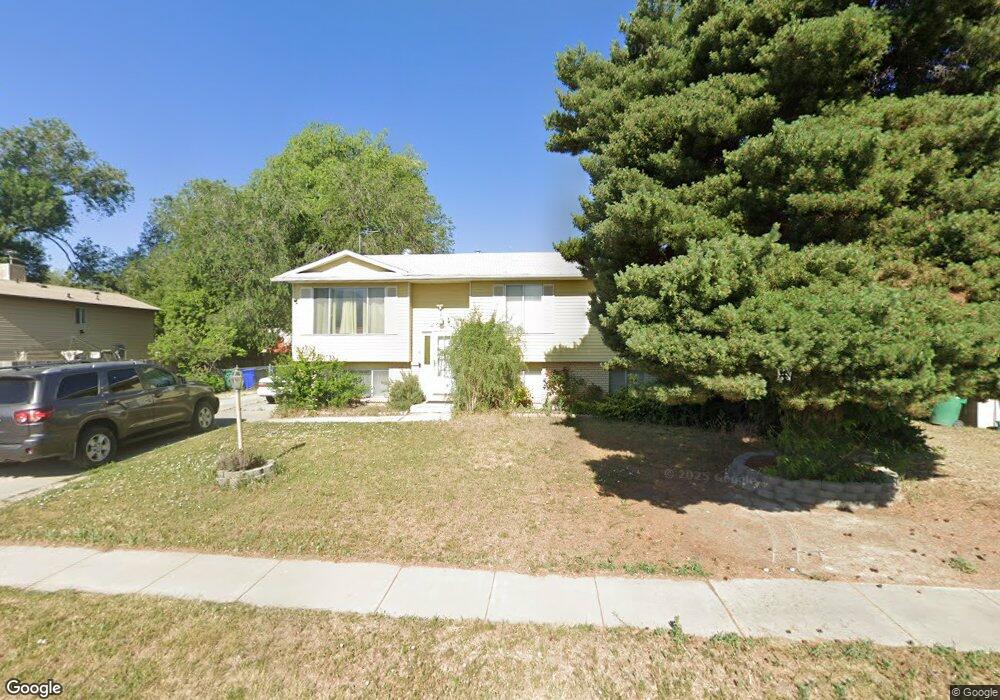
8234 S 1600 W West Jordan, UT 84088
Estimated Value: $439,000 - $488,000
4
Beds
2
Baths
993
Sq Ft
$461/Sq Ft
Est. Value
About This Home
This home is located at 8234 S 1600 W, West Jordan, UT 84088 and is currently estimated at $457,309, approximately $460 per square foot. 8234 S 1600 W is a home located in Salt Lake County with nearby schools including Riverside Elementary School, West Jordan Middle School, and West Jordan High School.
Ownership History
Date
Name
Owned For
Owner Type
Purchase Details
Closed on
Jan 10, 2020
Sold by
Kumsooktawonge Phoumanivong and Sookvong Edgar Poomicy
Bought by
Kumsooktawonge Keenan P and Sookvong Edgar Poomicy
Current Estimated Value
Purchase Details
Closed on
Aug 17, 2011
Sold by
Chounlamany Phoumanivong and Phouxay Victor D
Bought by
Kumsooktawonge Phoumanivong and Sookvong Edgar Poomiey
Create a Home Valuation Report for This Property
The Home Valuation Report is an in-depth analysis detailing your home's value as well as a comparison with similar homes in the area
Home Values in the Area
Average Home Value in this Area
Purchase History
| Date | Buyer | Sale Price | Title Company |
|---|---|---|---|
| Kumsooktawonge Keenan P | -- | Accommodation | |
| Kumsooktawonge Phoumanivong | -- | None Available |
Source: Public Records
Tax History Compared to Growth
Tax History
| Year | Tax Paid | Tax Assessment Tax Assessment Total Assessment is a certain percentage of the fair market value that is determined by local assessors to be the total taxable value of land and additions on the property. | Land | Improvement |
|---|---|---|---|---|
| 2025 | $2,036 | $410,100 | $137,400 | $272,700 |
| 2024 | $2,036 | $391,700 | $126,500 | $265,200 |
| 2023 | $2,029 | $367,900 | $121,600 | $246,300 |
| 2022 | $2,118 | $377,800 | $119,300 | $258,500 |
| 2021 | $1,817 | $295,000 | $91,600 | $203,400 |
| 2020 | $1,726 | $263,100 | $79,200 | $183,900 |
| 2019 | $1,637 | $244,700 | $79,200 | $165,500 |
| 2018 | $1,486 | $220,300 | $75,700 | $144,600 |
| 2017 | $1,378 | $203,400 | $75,700 | $127,700 |
| 2016 | $1,303 | $180,600 | $75,700 | $104,900 |
| 2015 | $1,362 | $184,100 | $80,800 | $103,300 |
| 2014 | $1,222 | $162,600 | $72,100 | $90,500 |
Source: Public Records
Map
Nearby Homes
- 1636 Plum Creek Dr
- 1689 W 8295 S Unit 2
- 8155 S Redwood Rd Unit 88
- 8155 S Redwood Rd Unit 142B
- 8155 S Redwood Rd Unit 95
- 8155 S Redwood Rd Unit 28
- 1790 W Sugar Factory Rd
- 8510 S Redwood Rd
- 8518 S Redwood Rd
- 8534 S Redwood Rd
- 1434 Autumn Oak Cir
- Tundra Plan at Hidden Cove
- Woodland Plan at Hidden Cove
- Grassland Plan at Hidden Cove
- Blossom Plan at Hidden Cove
- Redwood Plan at Hidden Cove
- Hickory Plan at Hidden Cove
- Meadow Plan at Hidden Cove
- Ash Plan at Hidden Cove
- Hazel Plan at Hidden Cove