Estimated Value: $313,000 - $347,000
Studio
2
Baths
2,335
Sq Ft
$143/Sq Ft
Est. Value
About This Home
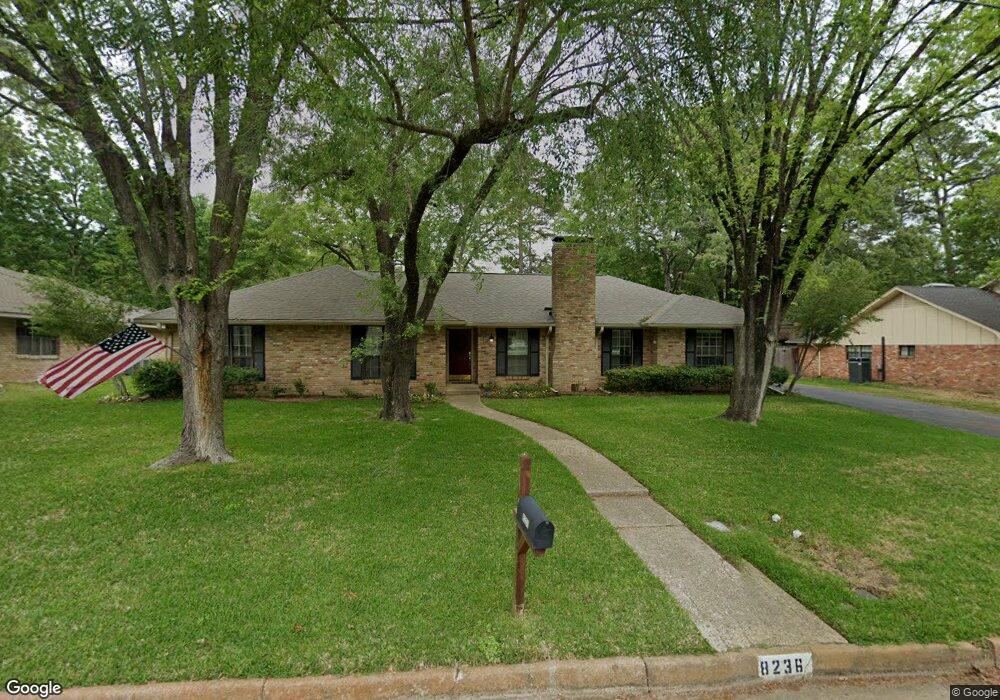
This home is located at 8236 8236 Purdue, Tyler, TX 75703 and is currently estimated at $333,091, approximately $142 per square foot. 8236 8236 Purdue is a home located in Smith County with nearby schools including Rice Elementary School, Hubbard Middle School, and Tyler Legacy High School.
Ownership History
Date
Name
Owned For
Owner Type
Purchase Details
Closed on
Oct 29, 2015
Sold by
Adams Jennifer and Adams Jennifer J
Bought by
Andries Paul Kent and Andries Courtney Bostwick
Current Estimated Value
Home Financials for this Owner
Home Financials are based on the most recent Mortgage that was taken out on this home.
Original Mortgage
$198,341
Outstanding Balance
$153,569
Interest Rate
3.5%
Mortgage Type
FHA
Estimated Equity
$179,522
Purchase Details
Closed on
Jun 21, 2011
Sold by
Adams Howard and Adams Jennifer
Bought by
Adams Jennifer and Adams Jennifer J
Home Financials for this Owner
Home Financials are based on the most recent Mortgage that was taken out on this home.
Original Mortgage
$147,100
Interest Rate
4.58%
Mortgage Type
Credit Line Revolving
Create a Home Valuation Report for This Property
The Home Valuation Report is an in-depth analysis detailing your home's value as well as a comparison with similar homes in the area
Purchase History
| Date | Buyer | Sale Price | Title Company |
|---|---|---|---|
| Andries Paul Kent | -- | None Available | |
| Adams Jennifer | -- | None Available |
Source: Public Records
Mortgage History
| Date | Status | Borrower | Loan Amount |
|---|---|---|---|
| Open | Andries Paul Kent | $198,341 | |
| Previous Owner | Adams Jennifer | $0 | |
| Previous Owner | Adams Jennifer | $147,100 |
Source: Public Records
Tax History
| Year | Tax Paid | Tax Assessment Tax Assessment Total Assessment is a certain percentage of the fair market value that is determined by local assessors to be the total taxable value of land and additions on the property. | Land | Improvement |
|---|---|---|---|---|
| 2025 | $4,167 | $324,390 | $56,417 | $267,973 |
| 2024 | $4,060 | $296,849 | $44,520 | $289,122 |
| 2023 | $4,704 | $335,115 | $44,520 | $290,595 |
| 2022 | $4,806 | $283,722 | $35,913 | $247,809 |
| 2021 | $4,679 | $223,027 | $35,913 | $187,114 |
| 2020 | $4,642 | $216,942 | $35,913 | $181,029 |
| 2019 | $4,450 | $203,509 | $29,680 | $173,829 |
| 2018 | $4,311 | $198,224 | $29,680 | $168,544 |
| 2017 | $4,232 | $198,224 | $29,680 | $168,544 |
| 2016 | $3,864 | $180,976 | $29,680 | $151,296 |
| 2015 | $3,448 | $174,611 | $29,680 | $144,931 |
| 2014 | $3,448 | $173,785 | $29,680 | $144,105 |
Source: Public Records
Map
Nearby Homes
- 8235 Baylor Dr
- 700 Oxford Dr
- 8212 Cambridge Rd
- 609 Potomac Dr
- 700 David Dr
- 8307 Garrett Dr
- 6443 Rochester Way
- 809 Jeffery Dr
- 809 David Dr
- 725 Beth Dr
- 308 Canterbury Ct
- 801 Beth Dr
- 6522 Emory Ct
- 6518 Rochester Way
- 628 Wilder Way
- 716 Wilder Way
- 505 Bentley Ct
- 7614 Abbeywood Ct
- 1302 Jeb Stuart Dr
- 419 Wilder Way
- 8236 Purdue Dr
- 8230 Purdue Dr
- 8238 Purdue Dr
- 8235 Clemson Dr
- 8233 Clemson Dr
- 8235 8235 Clemson
- 8233 8233 Clemson
- 8228 8228 Purdue
- 8237 Clemson Dr
- 8229 8229 Clemson
- 8229 Clemson Dr
- 8228 Purdue Dr
- 8233 Purdue Dr
- 8237 Purdue Dr
- 8240 Purdue Dr
- 8229 8229 Purdue Dr
- 8229 Purdue Dr
- 8239 8239 Purdue
- 8227 Clemson Dr
- 8239 Purdue Dr
Your Personal Tour Guide
Ask me questions while you tour the home.