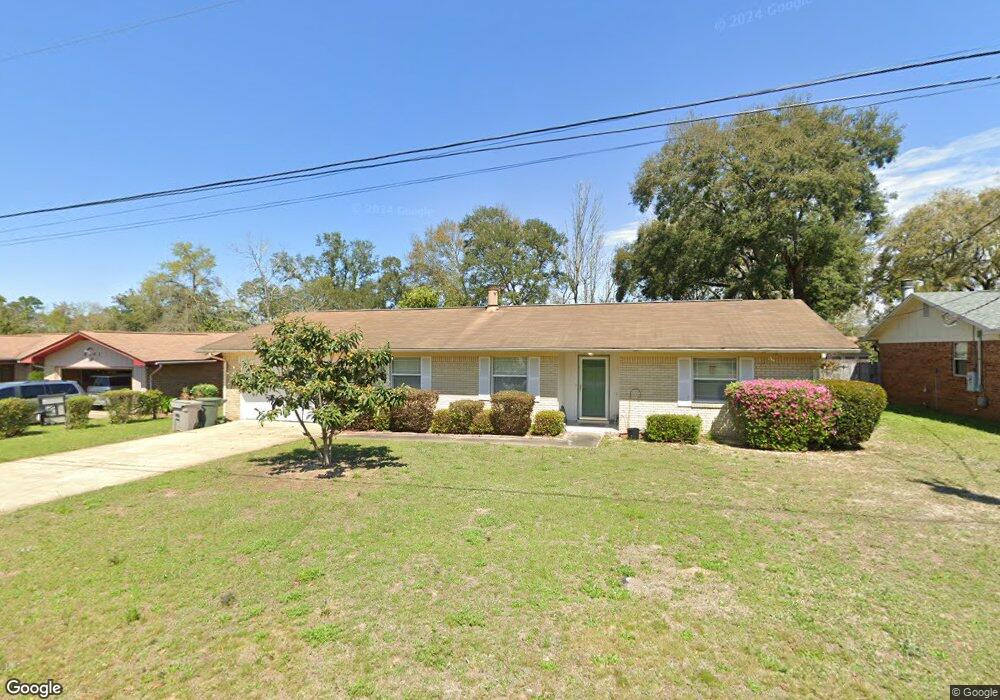
8238 Emperor Rd Unit 2 Pensacola, FL 32514
Estimated Value: $239,000 - $265,000
--
Bed
2
Baths
1,532
Sq Ft
$168/Sq Ft
Est. Value
About This Home
This home is located at 8238 Emperor Rd Unit 2, Pensacola, FL 32514 and is currently estimated at $256,759, approximately $167 per square foot. 8238 Emperor Rd Unit 2 is a home located in Escambia County with nearby schools including Ferry Pass Elementary School, Ferry Pass Middle School, and Booker T. Washington High School.
Ownership History
Date
Name
Owned For
Owner Type
Purchase Details
Closed on
Jul 15, 2011
Sold by
Ausmus Michael D and Ausmus Cristina T
Bought by
Hoven Nancy L
Current Estimated Value
Purchase Details
Closed on
Feb 27, 2006
Sold by
Russo Kathleen R
Bought by
Ausmus Michael D and Ausmus Cristina T
Purchase Details
Closed on
Jan 3, 2003
Sold by
Higgins Gary W and Higgins Shannon
Bought by
Russo Kathleen R
Home Financials for this Owner
Home Financials are based on the most recent Mortgage that was taken out on this home.
Original Mortgage
$86,850
Interest Rate
6.1%
Purchase Details
Closed on
Nov 6, 1998
Sold by
Miller Mark Garland and Miller Susan Lynn
Bought by
Higgins Gary W
Home Financials for this Owner
Home Financials are based on the most recent Mortgage that was taken out on this home.
Original Mortgage
$78,016
Interest Rate
6.65%
Mortgage Type
FHA
Create a Home Valuation Report for This Property
The Home Valuation Report is an in-depth analysis detailing your home's value as well as a comparison with similar homes in the area
Home Values in the Area
Average Home Value in this Area
Purchase History
| Date | Buyer | Sale Price | Title Company |
|---|---|---|---|
| Hoven Nancy L | $100,000 | First American Title Ins Co | |
| Ausmus Michael D | $97,000 | Lawyers Title Ins | |
| Russo Kathleen R | $96,500 | -- | |
| Higgins Gary W | $78,100 | -- |
Source: Public Records
Mortgage History
| Date | Status | Borrower | Loan Amount |
|---|---|---|---|
| Previous Owner | Russo Kathleen R | $86,850 | |
| Previous Owner | Higgins Gary W | $78,016 |
Source: Public Records
Tax History Compared to Growth
Tax History
| Year | Tax Paid | Tax Assessment Tax Assessment Total Assessment is a certain percentage of the fair market value that is determined by local assessors to be the total taxable value of land and additions on the property. | Land | Improvement |
|---|---|---|---|---|
| 2024 | $917 | $102,983 | -- | -- |
| 2023 | $917 | $99,984 | $0 | $0 |
| 2022 | $888 | $97,072 | $0 | $0 |
| 2021 | $879 | $94,245 | $0 | $0 |
| 2020 | $858 | $92,944 | $0 | $0 |
| 2019 | $838 | $90,855 | $0 | $0 |
| 2018 | $832 | $89,161 | $0 | $0 |
| 2017 | $826 | $87,328 | $0 | $0 |
| 2016 | $815 | $85,532 | $0 | $0 |
| 2015 | $795 | $84,938 | $0 | $0 |
| 2014 | $783 | $84,264 | $0 | $0 |
Source: Public Records
Map
Nearby Homes
- 7911 Burstaff Rd
- 8204 Squire Rd
- 528 Eastwood Place
- 8481 Old Spanish Trail Rd
- 4210 Coldsprings Dr
- 8494 Olympia Rd
- 8468 Old Spanish Trail Rd
- 8613 Happy Valley Trail
- 8449 Old Spanish Trail Rd
- 4221 Burtonwood Dr
- 4587 Tradewinds Way
- 4310 Cheltenham Cir
- 4622 Citadel Dr
- 8375 Strasburg Rd
- 8355 Strasburg Rd
- 4831 E Olive Rd Unit 2A
- 4485 Yarmouth Place
- 3901 Croydon Rd
- 2114 Croydon Rd
- 4810 Rosemont Ct
- 8234 Emperor Rd
- 8242 Emperor Rd
- 8245 Squire Rd
- 8241 Squire Rd
- 8249 Squire Rd
- 8230 Emperor Rd
- 8246 Emperor Rd
- 8243 Emperor Rd
- 8247 Emperor Rd Unit 2
- 8239 Emperor Rd
- 8237 Squire Rd
- 8253 Squire Rd
- 8235 Emperor Rd
- 8226 Emperor Rd
- 8251 Emperor Rd
- 0 Jumento Dr Unit 616038
- 0 Jumento Dr Unit 351972
- 0 Jumento Dr Unit 354925
- 0 Jumento Dr Unit 378838
- 0 Jumento Dr Unit 384869