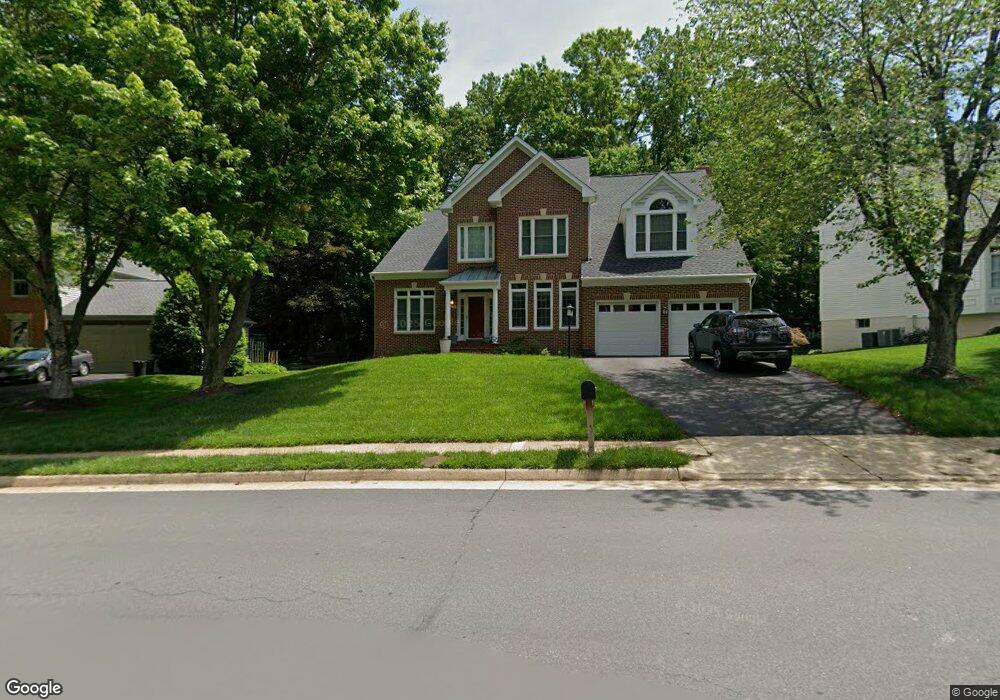
8239 Silverline Dr Fairfax Station, VA 22039
Crosspointe NeighborhoodEstimated Value: $1,159,578 - $1,246,000
4
Beds
4
Baths
3,369
Sq Ft
$354/Sq Ft
Est. Value
About This Home
This home is located at 8239 Silverline Dr, Fairfax Station, VA 22039 and is currently estimated at $1,194,145, approximately $354 per square foot. 8239 Silverline Dr is a home located in Fairfax County with nearby schools including Silverbrook Elementary School, South County Middle School, and South County High School.
Ownership History
Date
Name
Owned For
Owner Type
Purchase Details
Closed on
Oct 3, 2012
Sold by
Burris Carl H and Burris Meredith
Bought by
Burris Meredith
Current Estimated Value
Home Financials for this Owner
Home Financials are based on the most recent Mortgage that was taken out on this home.
Original Mortgage
$567,400
Outstanding Balance
$399,686
Interest Rate
3.88%
Mortgage Type
New Conventional
Estimated Equity
$794,459
Purchase Details
Closed on
Nov 13, 2002
Sold by
Lennon George D
Bought by
Burris Carl H
Home Financials for this Owner
Home Financials are based on the most recent Mortgage that was taken out on this home.
Original Mortgage
$466,000
Interest Rate
6.03%
Purchase Details
Closed on
Sep 29, 1994
Sold by
South Run Lp
Bought by
Lennon George D
Home Financials for this Owner
Home Financials are based on the most recent Mortgage that was taken out on this home.
Original Mortgage
$265,300
Interest Rate
8.5%
Create a Home Valuation Report for This Property
The Home Valuation Report is an in-depth analysis detailing your home's value as well as a comparison with similar homes in the area
Home Values in the Area
Average Home Value in this Area
Purchase History
| Date | Buyer | Sale Price | Title Company |
|---|---|---|---|
| Burris Meredith | -- | -- | |
| Burris Carl H | $582,500 | -- | |
| Lennon George D | $331,645 | -- |
Source: Public Records
Mortgage History
| Date | Status | Borrower | Loan Amount |
|---|---|---|---|
| Open | Burris Meredith | $567,400 | |
| Previous Owner | Burris Carl H | $466,000 | |
| Previous Owner | Lennon George D | $265,300 |
Source: Public Records
Tax History Compared to Growth
Tax History
| Year | Tax Paid | Tax Assessment Tax Assessment Total Assessment is a certain percentage of the fair market value that is determined by local assessors to be the total taxable value of land and additions on the property. | Land | Improvement |
|---|---|---|---|---|
| 2025 | $11,061 | $994,510 | $366,000 | $628,510 |
| 2024 | $11,061 | $954,780 | $341,000 | $613,780 |
| 2023 | $10,702 | $948,380 | $341,000 | $607,380 |
| 2022 | $9,747 | $852,350 | $301,000 | $551,350 |
| 2021 | $9,173 | $781,720 | $271,000 | $510,720 |
| 2020 | $8,744 | $738,830 | $251,000 | $487,830 |
| 2019 | $8,638 | $729,900 | $251,000 | $478,900 |
| 2018 | $8,229 | $715,600 | $246,000 | $469,600 |
| 2017 | $8,308 | $715,600 | $246,000 | $469,600 |
| 2016 | $8,290 | $715,600 | $246,000 | $469,600 |
| 2015 | $8,148 | $730,120 | $246,000 | $484,120 |
| 2014 | $7,917 | $711,020 | $241,000 | $470,020 |
Source: Public Records
Map
Nearby Homes
- 8410 Copperleaf Ct
- 8106 Oak Hollow Ct
- 8217 Bayberry Ridge Rd
- 9211 Bexleywood Ct
- 8786 Newington Commons Rd
- 8003 Comerford Dr
- The Taylor Plan at Southern Oaks Reserve
- The Grant Plan at Southern Oaks Reserve
- 8757 Southern Oaks Place
- 8622 Cross Chase Ct
- 8783 Brook Estates Ct
- 8011 Treasure Tree Ct
- 8719 Cross Chase Cir
- 9007 Golden Sunset Ln
- 8017 Galla Knoll Cir
- 8004 Chippenham Ct
- 9419 Braymore Cir
- 8015 Steeple Chase Ct
- 7917 Valleyfield Dr
- 7832 Valleyfield Dr
- 8237 Silverline Dr
- 9130 Silver Pointe Way
- 9126 Silver Pointe Way
- 8238 Silverline Dr
- 9148 Wood Pointe Way
- 9150 Wood Pointe Way
- 8235 Silverline Dr
- 8240 Silverline Dr
- 9146 Wood Pointe Way
- 9124 Silver Pointe Way
- 8236 Silverline Dr
- 9144 Wood Pointe Way
- 8233 Silverline Dr
- 8844 Silverline Dr
- 9127 Silver Pointe Way
- 8846 Silverline Dr
- 8234 Silverline Dr
- 9142 Wood Pointe Way
- 9125 Silver Pointe Way
- 9131 Silver Pointe Way