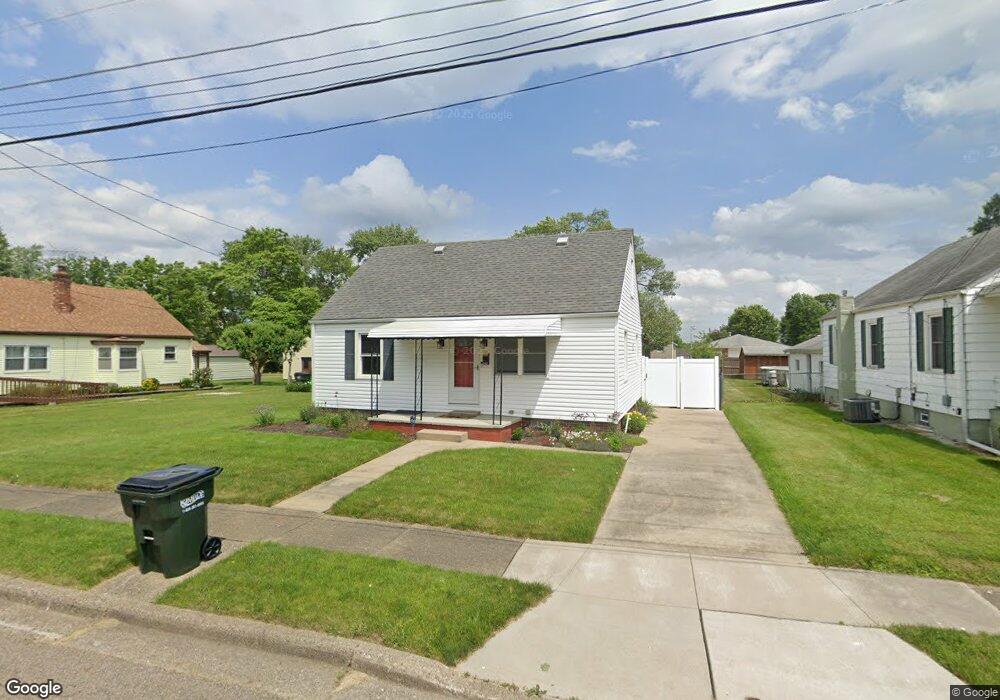
824 Bernard Ave SW Massillon, OH 44647
Lawndale NeighborhoodEstimated Value: $120,000 - $160,000
2
Beds
2
Baths
1,080
Sq Ft
$132/Sq Ft
Est. Value
About This Home
This home is located at 824 Bernard Ave SW, Massillon, OH 44647 and is currently estimated at $142,780, approximately $132 per square foot. 824 Bernard Ave SW is a home located in Stark County with nearby schools including Massillon Intermediate School, Massillon Junior High School, and Washington High School.
Ownership History
Date
Name
Owned For
Owner Type
Purchase Details
Closed on
Mar 13, 2024
Sold by
Preiss Diann L
Bought by
Zehentbauer Zebediah Paul
Current Estimated Value
Home Financials for this Owner
Home Financials are based on the most recent Mortgage that was taken out on this home.
Original Mortgage
$106,400
Outstanding Balance
$104,630
Interest Rate
6.63%
Mortgage Type
New Conventional
Estimated Equity
$38,150
Purchase Details
Closed on
Aug 5, 2009
Sold by
Ross Garold E
Bought by
Ross Linda L
Purchase Details
Closed on
Jul 24, 2003
Sold by
Ross Velma F
Bought by
Ross Garold E and Ross Linda L
Create a Home Valuation Report for This Property
The Home Valuation Report is an in-depth analysis detailing your home's value as well as a comparison with similar homes in the area
Home Values in the Area
Average Home Value in this Area
Purchase History
| Date | Buyer | Sale Price | Title Company |
|---|---|---|---|
| Zehentbauer Zebediah Paul | -- | None Listed On Document | |
| Ross Linda L | $30,000 | Attorney | |
| Ross Garold E | -- | -- |
Source: Public Records
Mortgage History
| Date | Status | Borrower | Loan Amount |
|---|---|---|---|
| Open | Zehentbauer Zebediah Paul | $106,400 |
Source: Public Records
Tax History Compared to Growth
Tax History
| Year | Tax Paid | Tax Assessment Tax Assessment Total Assessment is a certain percentage of the fair market value that is determined by local assessors to be the total taxable value of land and additions on the property. | Land | Improvement |
|---|---|---|---|---|
| 2025 | -- | $36,860 | $8,750 | $28,110 |
| 2024 | -- | $36,860 | $8,750 | $28,110 |
| 2023 | $934 | $26,540 | $7,320 | $19,220 |
| 2022 | $914 | $26,540 | $7,320 | $19,220 |
| 2021 | $929 | $26,540 | $7,320 | $19,220 |
| 2020 | $670 | $20,800 | $5,990 | $14,810 |
| 2019 | $661 | $20,800 | $5,990 | $14,810 |
| 2018 | $657 | $20,800 | $5,990 | $14,810 |
| 2017 | $321 | $14,190 | $4,730 | $9,460 |
| 2016 | $326 | $14,190 | $4,730 | $9,460 |
| 2015 | $322 | $14,190 | $4,730 | $9,460 |
| 2014 | $308 | $13,770 | $4,590 | $9,180 |
| 2013 | $157 | $13,770 | $4,590 | $9,180 |
Source: Public Records
Map
Nearby Homes
- 827 9th St SW
- 878 Liberty Ct SW
- 718 Bebb Ave SW
- 315 14th St SW
- 533 Webb Ave SW
- 504 5th St SW
- 532 4th St SW
- 101 14th St NW
- 1104 4th St SW
- 1301 Lincoln Way NW
- 728 Hillside Place SW
- 309 15th St NW
- 17 Maple Ave SE
- 2488 Carlene Ave SW
- 202 Rose Ave SE
- 3414 Joyce Ave NW Unit 18
- Lot 42 Joyce Ave NW
- 3447 Marys Way Ave NW
- 3476 Joyce Ave NW Unit 15
- 1737 Leslie St NW
- 824 Bernard St SW
- 816 Bernard Ave SW
- 816 Bernard Ave SW
- 830 Bernard Ave SW
- 810 Bernard Ave SW
- 823 Taylor St SW
- 821 Taylor St SW
- 944 Overlook Ave SW
- 817 Taylor St SW
- 806 Bernard Ave SW
- 831 Bernard Ave SW
- 959 Overlook Ave SW
- 1103 Overlook Ave SW
- 811 Bernard Ave SW
- 802 Bernard Ave SW
- 945 Overlook Ave SW
- 807 Bernard Ave SW
- 803 Taylor St SW
- 732 Bernard Ave SW
- 939 Overlook Ave SW