Estimated Value: $138,000 - $186,000
3
Beds
2
Baths
1,668
Sq Ft
$100/Sq Ft
Est. Value
About This Home
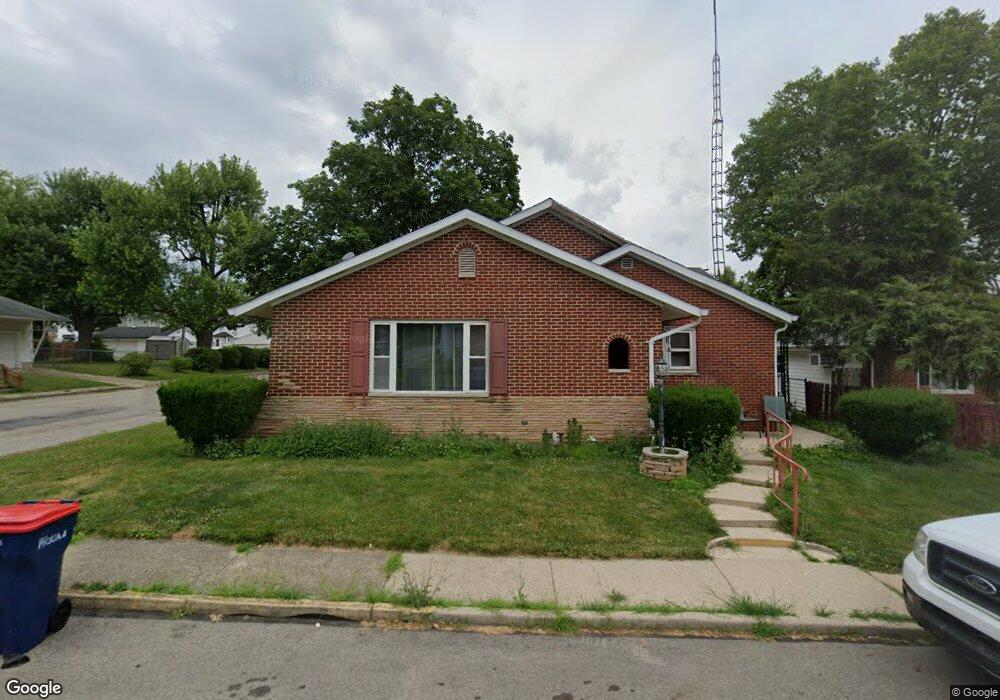
This home is located at 824 Brook St, Piqua, OH 45356 and is currently estimated at $167,246, approximately $100 per square foot. 824 Brook St is a home located in Miami County with nearby schools including Piqua Junior High School, Piqua High School, and Nicholas School.
Ownership History
Date
Name
Owned For
Owner Type
Purchase Details
Closed on
Mar 28, 2019
Sold by
Bodey Sheryl S and Wright Patt Credit Union
Bought by
Chappies Investments Llc
Current Estimated Value
Purchase Details
Closed on
Mar 11, 2005
Sold by
Bodey Sheryl S
Bought by
Bodey Sheryl S
Purchase Details
Closed on
Sep 20, 2004
Sold by
Bodey Kathryn E
Bought by
Bodey Sheryl S and Kathryn E Bodey Revocable Living Trust
Purchase Details
Closed on
Dec 18, 2003
Sold by
Bodey Sheryl and Bodey Jerry
Bought by
Bodey Sheryl S
Purchase Details
Closed on
Feb 7, 2002
Sold by
Bodey Harry R
Bought by
Bodey Kathryn E and Bodey Sheryl S
Purchase Details
Closed on
Jan 1, 1990
Bought by
Bodey Harry
Create a Home Valuation Report for This Property
The Home Valuation Report is an in-depth analysis detailing your home's value as well as a comparison with similar homes in the area
Home Values in the Area
Average Home Value in this Area
Purchase History
| Date | Buyer | Sale Price | Title Company |
|---|---|---|---|
| Chappies Investments Llc | $39,000 | None Available | |
| Bodey Sheryl S | -- | -- | |
| Bodey Sheryl S | -- | -- | |
| Bodey Sheryl S | -- | -- | |
| Bodey Kathryn E | -- | -- | |
| Bodey Harry | -- | -- |
Source: Public Records
Tax History
| Year | Tax Paid | Tax Assessment Tax Assessment Total Assessment is a certain percentage of the fair market value that is determined by local assessors to be the total taxable value of land and additions on the property. | Land | Improvement |
|---|---|---|---|---|
| 2025 | $2,248 | $62,060 | $6,130 | $55,930 |
| 2024 | $2,248 | $41,830 | $6,860 | $34,970 |
| 2023 | $1,764 | $41,830 | $6,860 | $34,970 |
| 2022 | $1,794 | $41,830 | $6,860 | $34,970 |
| 2021 | $1,449 | $30,980 | $5,080 | $25,900 |
| 2020 | $1,424 | $30,980 | $5,080 | $25,900 |
| 2019 | $1,485 | $30,980 | $5,080 | $25,900 |
| 2018 | $1,303 | $27,620 | $5,110 | $22,510 |
| 2017 | $1,319 | $27,620 | $5,110 | $22,510 |
| 2016 | $1,304 | $27,620 | $5,110 | $22,510 |
| 2015 | $1,319 | $26,670 | $4,900 | $21,770 |
| 2014 | $1,319 | $26,670 | $4,900 | $21,770 |
| 2013 | $1,323 | $26,670 | $4,900 | $21,770 |
Source: Public Records
Map
Nearby Homes
Your Personal Tour Guide
Ask me questions while you tour the home.