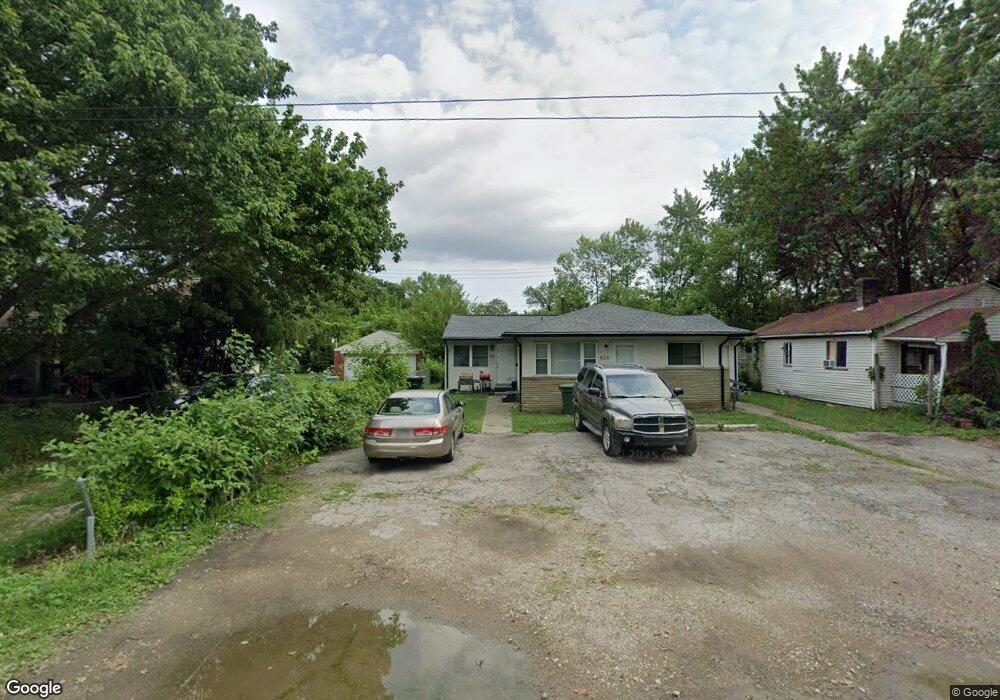
824 E Como Ave Unit 826 Columbus, OH 43224
North Linden NeighborhoodEstimated Value: $247,000 - $315,000
4
Beds
3
Baths
1,776
Sq Ft
$158/Sq Ft
Est. Value
About This Home
This home is located at 824 E Como Ave Unit 826, Columbus, OH 43224 and is currently estimated at $281,000, approximately $158 per square foot. 824 E Como Ave Unit 826 is a home located in Franklin County with nearby schools including Como Elementary School, Dominion Middle School, and Whetstone High School.
Ownership History
Date
Name
Owned For
Owner Type
Purchase Details
Closed on
Sep 25, 2020
Sold by
Macmed Llc
Bought by
Shark Realty Llc
Current Estimated Value
Purchase Details
Closed on
Jul 10, 2008
Sold by
Bringardner Jeffrey F and Bringardner Jane Z
Bought by
Macmed Llc
Home Financials for this Owner
Home Financials are based on the most recent Mortgage that was taken out on this home.
Original Mortgage
$80,000
Interest Rate
6.36%
Mortgage Type
Purchase Money Mortgage
Purchase Details
Closed on
Dec 19, 2007
Sold by
Como Property Llc
Bought by
Bringardner Jeffrey F
Purchase Details
Closed on
Mar 15, 2007
Sold by
Holzbacher Gary E
Bought by
Como Property Llc
Purchase Details
Closed on
Jan 29, 1992
Bought by
Holzbacher Gary E
Purchase Details
Closed on
Dec 31, 1991
Purchase Details
Closed on
Apr 1, 1979
Create a Home Valuation Report for This Property
The Home Valuation Report is an in-depth analysis detailing your home's value as well as a comparison with similar homes in the area
Home Values in the Area
Average Home Value in this Area
Purchase History
| Date | Buyer | Sale Price | Title Company |
|---|---|---|---|
| Shark Realty Llc | $110,000 | Transcounty Title Agency Llc | |
| Macmed Llc | $80,000 | Attorney | |
| Bringardner Jeffrey F | $173,000 | Golden Titl | |
| Como Property Llc | -- | None Available | |
| Holzbacher Gary E | $24,800 | -- | |
| -- | $54,900 | -- | |
| -- | $15,500 | -- |
Source: Public Records
Mortgage History
| Date | Status | Borrower | Loan Amount |
|---|---|---|---|
| Previous Owner | Macmed Llc | $80,000 |
Source: Public Records
Tax History
| Year | Tax Paid | Tax Assessment Tax Assessment Total Assessment is a certain percentage of the fair market value that is determined by local assessors to be the total taxable value of land and additions on the property. | Land | Improvement |
|---|---|---|---|---|
| 2025 | $2,505 | $54,670 | $9,240 | $45,430 |
| 2024 | $2,505 | $54,670 | $9,240 | $45,430 |
| 2023 | $2,624 | $54,670 | $9,240 | $45,430 |
| 2022 | $1,469 | $24,820 | $4,170 | $20,650 |
| 2021 | $1,471 | $24,820 | $4,170 | $20,650 |
| 2020 | $1,323 | $24,820 | $4,170 | $20,650 |
| 2019 | $1,287 | $20,690 | $3,470 | $17,220 |
| 2018 | $1,143 | $20,690 | $3,470 | $17,220 |
| 2017 | $1,193 | $20,690 | $3,470 | $17,220 |
| 2016 | $1,099 | $16,180 | $3,610 | $12,570 |
| 2015 | $1,001 | $16,180 | $3,610 | $12,570 |
| 2014 | $1,003 | $16,180 | $3,610 | $12,570 |
| 2013 | $581 | $19,005 | $4,235 | $14,770 |
Source: Public Records
Map
Nearby Homes
- 3035 Audubon Rd
- 759 E Longview Ave
- 914 Weldon Ave
- 612 E Como Ave
- 2888 Howey Rd
- 796 E Kenworth Rd
- 555 E Weber Rd
- 2733 Beulah Rd
- 580 Crestview Rd
- 2950 Grasmere Ave
- 2874 Grasmere Ave
- 2776 Howey Rd
- 589 Clinton Heights Ave
- 3147 Grasmere Ave
- 534 Walhalla Rd
- 2593 Osceola Ave
- 2593 Atwood Terrace
- 2569 Audubon Rd
- 2560 Osceola Ave
- 2582 Atwood Terrace
- 824 E Como Ave Unit 828
- 824 E Como Ave Unit 826, 828
- 820 E Como Ave
- 830 E Como Ave
- 816 E Como Ave
- 816 E Como Ave Unit A & B
- 840 E Como Ave
- 831 Wainwright Dr
- 825 Wainwright Dr
- 837 Wainwright Dr
- 808 E Como Ave Unit 812
- 844 E Como Ave
- 819 Wainwright Dr
- 843 Wainwright Dr
- 804 E Como Ave
- 849 Wainwright Dr
- 854 E Como Ave
- 823 E Como Ave
- 855 Wainwright Dr
- 817 E Como Ave
Your Personal Tour Guide
Ask me questions while you tour the home.