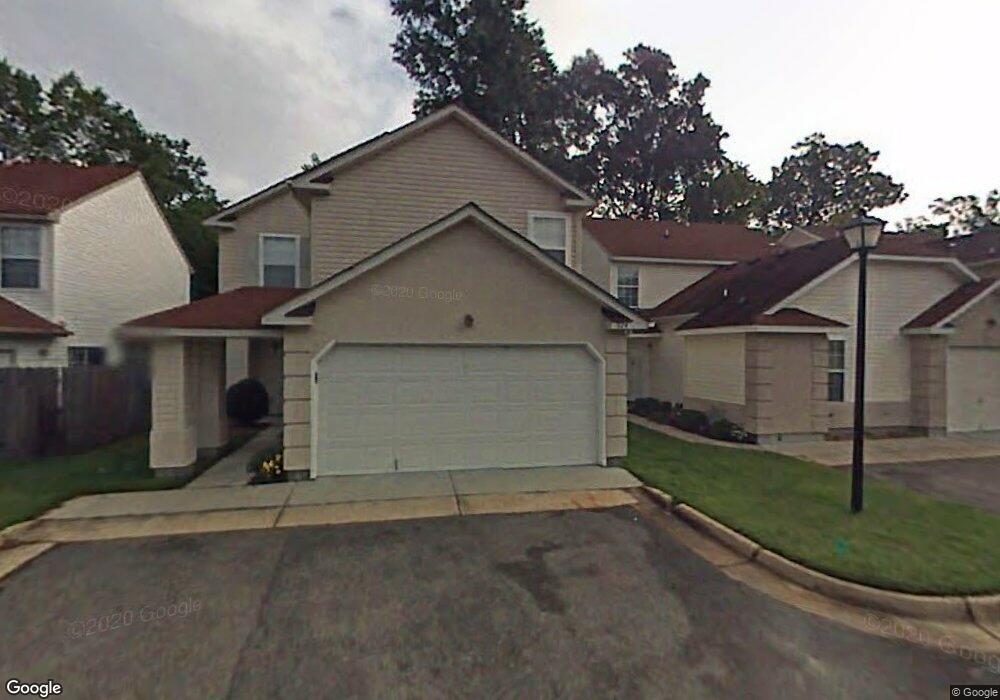
824 Fallcreek Run Chesapeake, VA 23322
Great Bridge NeighborhoodEstimated Value: $354,000 - $364,000
3
Beds
3
Baths
1,580
Sq Ft
$227/Sq Ft
Est. Value
About This Home
This home is located at 824 Fallcreek Run, Chesapeake, VA 23322 and is currently estimated at $359,089, approximately $227 per square foot. 824 Fallcreek Run is a home located in Chesapeake City with nearby schools including Cedar Road Elementary School, Hugo a Owens Middle, and Grassfield High School.
Ownership History
Date
Name
Owned For
Owner Type
Purchase Details
Closed on
Apr 1, 2008
Sold by
Strasshofer Steven
Bought by
Maslyn Christopher R and Wolnitzek,Kristen M
Current Estimated Value
Home Financials for this Owner
Home Financials are based on the most recent Mortgage that was taken out on this home.
Original Mortgage
$257,962
Outstanding Balance
$164,174
Interest Rate
6.06%
Mortgage Type
FHA
Estimated Equity
$194,915
Purchase Details
Closed on
May 23, 2006
Sold by
Drewry James C
Bought by
Deibig Brian A
Home Financials for this Owner
Home Financials are based on the most recent Mortgage that was taken out on this home.
Original Mortgage
$212,300
Interest Rate
6.62%
Mortgage Type
VA
Purchase Details
Closed on
Aug 30, 2000
Sold by
Yanta Mary C
Bought by
Drewry James C
Home Financials for this Owner
Home Financials are based on the most recent Mortgage that was taken out on this home.
Original Mortgage
$92,000
Interest Rate
8.1%
Purchase Details
Closed on
Feb 1, 2000
Sold by
Grippo Daniel W
Bought by
Yanta Mary Catherine
Create a Home Valuation Report for This Property
The Home Valuation Report is an in-depth analysis detailing your home's value as well as a comparison with similar homes in the area
Home Values in the Area
Average Home Value in this Area
Purchase History
| Date | Buyer | Sale Price | Title Company |
|---|---|---|---|
| Maslyn Christopher R | $260,000 | -- | |
| Deibig Brian A | $233,000 | -- | |
| Drewry James C | $115,000 | -- | |
| Yanta Mary Catherine | $119,000 | -- |
Source: Public Records
Mortgage History
| Date | Status | Borrower | Loan Amount |
|---|---|---|---|
| Open | Maslyn Christopher R | $257,962 | |
| Previous Owner | Deibig Brian A | $212,300 | |
| Previous Owner | Drewry James C | $92,000 |
Source: Public Records
Tax History Compared to Growth
Tax History
| Year | Tax Paid | Tax Assessment Tax Assessment Total Assessment is a certain percentage of the fair market value that is determined by local assessors to be the total taxable value of land and additions on the property. | Land | Improvement |
|---|---|---|---|---|
| 2025 | $3,385 | $348,200 | $120,000 | $228,200 |
| 2024 | $3,385 | $335,100 | $105,000 | $230,100 |
| 2023 | $2,942 | $328,300 | $95,000 | $233,300 |
| 2022 | $2,886 | $285,700 | $80,000 | $205,700 |
| 2021 | $2,682 | $255,400 | $70,000 | $185,400 |
| 2020 | $2,534 | $241,300 | $70,000 | $171,300 |
| 2019 | $2,254 | $214,700 | $65,000 | $149,700 |
| 2018 | $2,240 | $213,300 | $65,000 | $148,300 |
| 2017 | $2,178 | $207,400 | $60,000 | $147,400 |
| 2016 | $2,178 | $207,400 | $60,000 | $147,400 |
| 2015 | $2,125 | $202,400 | $55,000 | $147,400 |
| 2014 | $2,063 | $196,500 | $55,000 | $141,500 |
Source: Public Records
Map
Nearby Homes
- 832 Doe Run Dr
- 1000 Fox Ridge Ct
- 924 Fox Ridge Trail
- 406 Whisper Walk
- 902 Summerfield Crescent
- 303 Sherwood Forest Rd
- 504 Landmark Ct
- 329 Barcelona Dr
- 428 Moores Landing
- 345 Belle Ridge Ct
- 510 San Pedro Dr
- 303 Middle Oaks Dr
- 724 Brisa Ct
- 704 Washington Dr
- 444 Charleston St
- 301 Sikeston Ln
- 333 Sikeston Ln
- 341 Sikeston Ln
- 1041 Bells Mill Rd
- 1161 Bells Mill Rd
- 820 Fallcreek Run
- 828 Fallcreek Run
- 816 Fallcreek Run
- 832 Fallcreek Run
- 825 Fallcreek Run
- 924 Larkspur Ln
- 812 Fallcreek Run
- 829 Fallcreek Run
- 821 Fallcreek Run
- 920 Larkspur Ln
- 833 Fallcreek Run
- 926 Larkspur Ln
- 817 Fallcreek Run
- 808 Fallcreek Run
- 813 Fallcreek Run
- 904 Fallcreek Run
- 908 Fallcreek Run
- 916 Larkspur Ln
- 804 Fallcreek Run
- 912 Fallcreek Run