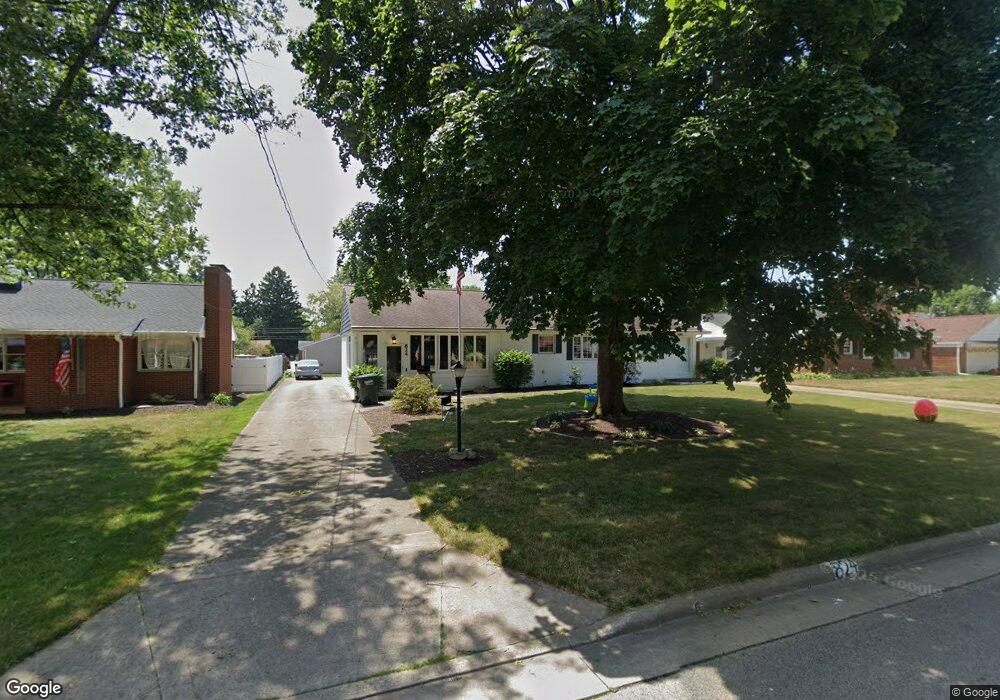
824 Harmon St SW North Canton, OH 44720
Estimated Value: $192,000 - $225,000
3
Beds
1
Bath
1,242
Sq Ft
$166/Sq Ft
Est. Value
About This Home
This home is located at 824 Harmon St SW, North Canton, OH 44720 and is currently estimated at $206,068, approximately $165 per square foot. 824 Harmon St SW is a home located in Stark County with nearby schools including Orchard Hill Intermediate School, North Canton Middle School, and Hoover High School.
Ownership History
Date
Name
Owned For
Owner Type
Purchase Details
Closed on
Mar 17, 2025
Sold by
Lea Ned W and Lea Deborah J
Bought by
Lea Ned W and Lea Emily
Current Estimated Value
Home Financials for this Owner
Home Financials are based on the most recent Mortgage that was taken out on this home.
Original Mortgage
$140,000
Outstanding Balance
$137,087
Interest Rate
6.05%
Mortgage Type
New Conventional
Estimated Equity
$68,981
Purchase Details
Closed on
Nov 19, 2018
Sold by
Lee Deborah J
Bought by
Lee Deborah J and Lee Ned W
Home Financials for this Owner
Home Financials are based on the most recent Mortgage that was taken out on this home.
Original Mortgage
$55,000
Interest Rate
4.9%
Mortgage Type
Future Advance Clause Open End Mortgage
Purchase Details
Closed on
May 27, 2015
Sold by
Rice Becca S
Bought by
Lea Deborah J
Purchase Details
Closed on
Oct 28, 1991
Create a Home Valuation Report for This Property
The Home Valuation Report is an in-depth analysis detailing your home's value as well as a comparison with similar homes in the area
Home Values in the Area
Average Home Value in this Area
Purchase History
| Date | Buyer | Sale Price | Title Company |
|---|---|---|---|
| Lea Ned W | -- | None Listed On Document | |
| Lee Deborah J | -- | None Available | |
| Lea Deborah J | -- | None Available | |
| -- | -- | -- |
Source: Public Records
Mortgage History
| Date | Status | Borrower | Loan Amount |
|---|---|---|---|
| Open | Lea Ned W | $140,000 | |
| Previous Owner | Lee Deborah J | $55,000 |
Source: Public Records
Tax History Compared to Growth
Tax History
| Year | Tax Paid | Tax Assessment Tax Assessment Total Assessment is a certain percentage of the fair market value that is determined by local assessors to be the total taxable value of land and additions on the property. | Land | Improvement |
|---|---|---|---|---|
| 2025 | -- | $55,830 | $15,020 | $40,810 |
| 2024 | -- | $55,830 | $15,020 | $40,810 |
| 2023 | $2,517 | $46,100 | $11,270 | $34,830 |
| 2022 | $2,422 | $46,100 | $11,270 | $34,830 |
| 2021 | $2,338 | $46,100 | $11,270 | $34,830 |
| 2020 | $2,199 | $38,920 | $9,800 | $29,120 |
| 2019 | $2,057 | $38,920 | $9,800 | $29,120 |
| 2018 | $2,133 | $38,920 | $9,800 | $29,120 |
| 2017 | $1,925 | $36,760 | $9,560 | $27,200 |
| 2016 | $1,932 | $36,760 | $9,560 | $27,200 |
| 2015 | $1,922 | $36,440 | $9,560 | $26,880 |
| 2014 | $1,312 | $32,590 | $8,540 | $24,050 |
| 2013 | $659 | $32,590 | $8,540 | $24,050 |
Source: Public Records
Map
Nearby Homes
- 0 W Maple St Unit 5135089
- 727 Lorena St SW
- 1236 W Maple St
- 1246 W Maple St Unit 4A
- 1222 W Maple St Unit 6A
- 1171 Terrace Rd NW
- 624 Portage St NW
- 742 Portage St NW
- 455 Royer Ave NW
- 1138 Lindy Lane Ave SW
- 608 Werstler Ave NW
- 404 Cordelia St SW
- 404 7th St NW
- 253 Glenwood St SW
- 1276 Linwood Ave SW
- 140 5th St NE
- 1015 Lois Ave NW
- 406 Hower St NE
- 218 Bonnett St SW
- 448 Hower St NE
- 828 Harmon St SW
- 820 Harmon St SW
- 825 Church St SW
- 832 Harmon St SW
- 816 Harmon St SW
- 829 Church St SW
- 821 Church St SW
- 825 Harmon St SW
- 821 Harmon St SW
- 829 Harmon St SW
- 817 Church St SW
- 812 Harmon St SW
- 833 Harmon St SW
- 817 Harmon St SW
- 813 Church St SW
- 135 Middlesworth Ave SW
- 209 Middlesworth Ave SW
- 813 Harmon St SW
- 221 Middlesworth Ave SW
- 129 Middlesworth Ave SW