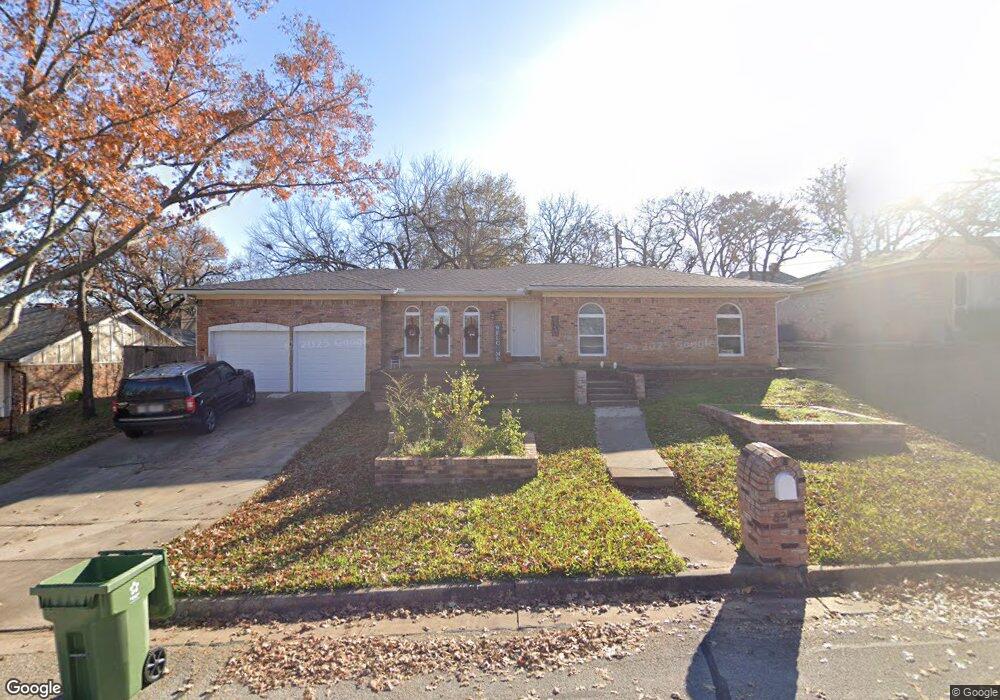
824 San Marcos Ln Bedford, TX 76021
Estimated Value: $372,222 - $401,000
3
Beds
2
Baths
1,942
Sq Ft
$199/Sq Ft
Est. Value
About This Home
This home is located at 824 San Marcos Ln, Bedford, TX 76021 and is currently estimated at $385,556, approximately $198 per square foot. 824 San Marcos Ln is a home located in Tarrant County with nearby schools including Shady Brook Elementary School, Bedford Junior High School, and L.D. Bell High School.
Ownership History
Date
Name
Owned For
Owner Type
Purchase Details
Closed on
Dec 31, 2018
Sold by
Hill Ryan C
Bought by
Henk Robert Allen
Current Estimated Value
Home Financials for this Owner
Home Financials are based on the most recent Mortgage that was taken out on this home.
Original Mortgage
$218,500
Outstanding Balance
$192,878
Interest Rate
4.8%
Mortgage Type
Purchase Money Mortgage
Estimated Equity
$192,678
Purchase Details
Closed on
Jun 20, 2014
Sold by
Chou Chao Li and Chen Chin Feng
Bought by
Hill Ryan C
Home Financials for this Owner
Home Financials are based on the most recent Mortgage that was taken out on this home.
Original Mortgage
$24,900
Interest Rate
4.27%
Mortgage Type
Purchase Money Mortgage
Purchase Details
Closed on
Feb 22, 2005
Sold by
The Watts Family Trust
Bought by
Chou Chao Li and Chen Chin Feng
Purchase Details
Closed on
Sep 10, 1999
Sold by
Watts Donald W and Watts Betty J
Bought by
Watts Donald William and Watts Betty Jean
Create a Home Valuation Report for This Property
The Home Valuation Report is an in-depth analysis detailing your home's value as well as a comparison with similar homes in the area
Home Values in the Area
Average Home Value in this Area
Purchase History
| Date | Buyer | Sale Price | Title Company |
|---|---|---|---|
| Henk Robert Allen | -- | None Available | |
| Hill Ryan C | -- | None Available | |
| Chou Chao Li | -- | Allegiance Title Co | |
| Watts Donald William | -- | -- |
Source: Public Records
Mortgage History
| Date | Status | Borrower | Loan Amount |
|---|---|---|---|
| Open | Henk Robert Allen | $218,500 | |
| Previous Owner | Hill Ryan C | $24,900 |
Source: Public Records
Tax History Compared to Growth
Tax History
| Year | Tax Paid | Tax Assessment Tax Assessment Total Assessment is a certain percentage of the fair market value that is determined by local assessors to be the total taxable value of land and additions on the property. | Land | Improvement |
|---|---|---|---|---|
| 2025 | $5,578 | $352,449 | $65,000 | $287,449 |
| 2024 | $5,578 | $352,449 | $65,000 | $287,449 |
| 2023 | $6,192 | $337,803 | $40,000 | $297,803 |
| 2022 | $6,410 | $300,195 | $40,000 | $260,195 |
| 2021 | $6,284 | $290,225 | $40,000 | $250,225 |
| 2020 | $5,767 | $242,535 | $40,000 | $202,535 |
| 2019 | $5,621 | $231,373 | $40,000 | $191,373 |
| 2018 | $4,504 | $201,114 | $40,000 | $161,114 |
| 2017 | $4,423 | $203,658 | $25,000 | $178,658 |
| 2016 | $4,021 | $185,677 | $25,000 | $160,677 |
| 2015 | $3,519 | $151,100 | $17,000 | $134,100 |
| 2014 | $3,519 | $151,100 | $17,000 | $134,100 |
Source: Public Records
Map
Nearby Homes
- 817 Shady Lake Dr
- 2436 Brookgreen Ct
- 1740 Brown Trail
- 2420 Stonegate Dr N
- 922 Shady Creek Ln
- 801 Shady Creek Ln
- 2501 Shady Grove Dr
- 1013 Springdale Rd
- 2317 Shady Grove Dr
- 2225 Shady Brook Dr
- 2700 Shady Grove Dr
- 2704 Shady Grove Dr
- 3119 Spring Grove Dr
- 432 Sunnybrook Ct
- 2508 Lakeview Dr
- 3213 Spring Valley Dr
- 1732 Jeannie Ln
- 124 Jeannie Ct
- 2116 Tamworth Ct
- 121 Kay Ct
- 828 San Marcos Ln
- 820 San Marcos Ln
- 817 Mayfair Hill Ct
- 809 Mayfair Hill Ct
- 816 San Marcos Ln
- 832 San Marcos Ln
- 821 San Marcos Ln
- 825 San Marcos Ln
- 821 Mayfair Hill Ct
- 817 San Marcos Ln
- 829 San Marcos Ln
- 805 Mayfair Hill Ct
- 812 San Marcos Ln
- 836 San Marcos Ln
- 813 San Marcos Ln
- 825 Mayfair Hill Ct
- 816 Mayfair Hill Ct
- 833 San Marcos Ln
- 820 Mayfair Hill Ct
- 812 Mayfair Hill Ct