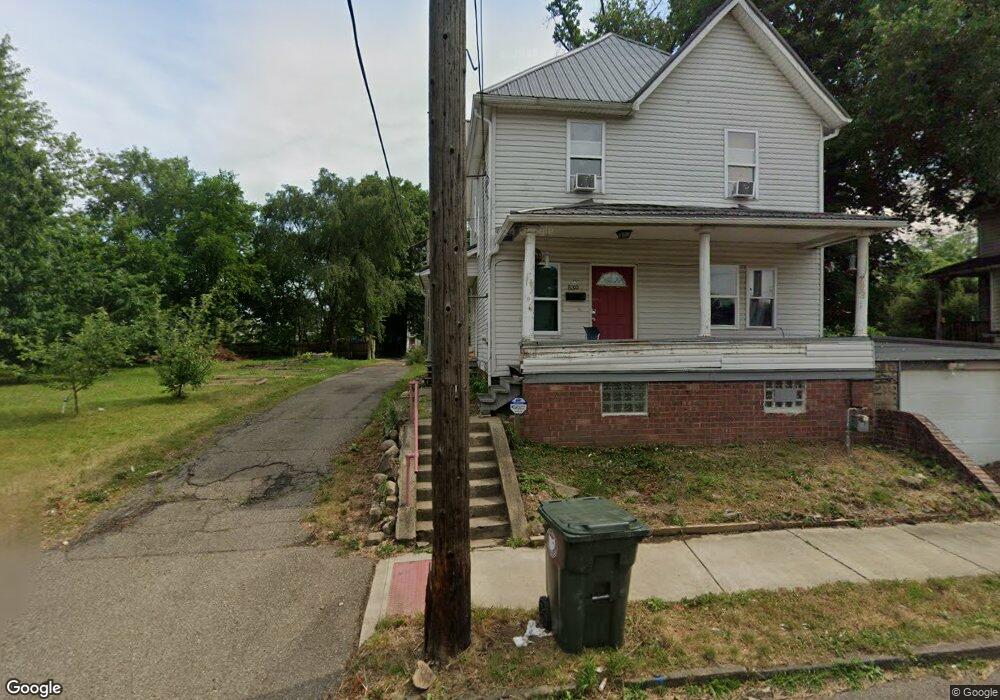
824 Troy Place NW Canton, OH 44703
Summit NeighborhoodEstimated Value: $93,000 - $185,000
--
Bed
2
Baths
--
Sq Ft
5,663
Sq Ft Lot
About This Home
This home is located at 824 Troy Place NW, Canton, OH 44703 and is currently estimated at $139,000. 824 Troy Place NW is a home located in Stark County with nearby schools including Early Learning Center @ Schreiber, Gibbs Elementary School, and Clarendon Intermediate School.
Ownership History
Date
Name
Owned For
Owner Type
Purchase Details
Closed on
Sep 9, 2013
Sold by
Fasterling Kelly Watkins and Watkins Kelly
Bought by
Ramos Stepheni Elizabeth
Current Estimated Value
Purchase Details
Closed on
May 28, 2009
Sold by
Mohawk Diversified Llc
Bought by
Watkins Kelly
Purchase Details
Closed on
May 12, 2009
Sold by
Go Invest Wisely Llc
Bought by
Mohawk Diversified Llc
Purchase Details
Closed on
May 9, 2008
Sold by
Liberty Alliance Llc
Bought by
Go Invest Wisely Llc
Purchase Details
Closed on
Apr 29, 2008
Sold by
National City Bank
Bought by
Liberty Alliance Llc
Purchase Details
Closed on
Dec 12, 2007
Sold by
Fuller Sandra J
Bought by
National City Bank
Purchase Details
Closed on
Jan 28, 2005
Sold by
Fuller Sandra J
Bought by
Seven X Seven Llc
Purchase Details
Closed on
Feb 3, 2000
Sold by
Marsh Joseph H and Marsh Joyce R
Bought by
Fuller Sandra J and Filkill Patrick H
Purchase Details
Closed on
Oct 20, 1993
Create a Home Valuation Report for This Property
The Home Valuation Report is an in-depth analysis detailing your home's value as well as a comparison with similar homes in the area
Home Values in the Area
Average Home Value in this Area
Purchase History
| Date | Buyer | Sale Price | Title Company |
|---|---|---|---|
| Ramos Stepheni Elizabeth | $1,000 | None Available | |
| Watkins Kelly | $18,500 | Attorney | |
| Mohawk Diversified Llc | $12,700 | Attorney | |
| Go Invest Wisely Llc | -- | None Available | |
| Liberty Alliance Llc | $5,500 | Attorney | |
| National City Bank | $40,000 | None Available | |
| Seven X Seven Llc | -- | -- | |
| Fuller Sandra J | $25,000 | -- | |
| -- | $10,000 | -- |
Source: Public Records
Tax History Compared to Growth
Tax History
| Year | Tax Paid | Tax Assessment Tax Assessment Total Assessment is a certain percentage of the fair market value that is determined by local assessors to be the total taxable value of land and additions on the property. | Land | Improvement |
|---|---|---|---|---|
| 2025 | -- | $1,930 | $1,930 | -- |
| 2024 | -- | $1,930 | $1,930 | -- |
| 2023 | $73 | $1,160 | $1,160 | -- |
| 2022 | $75 | $1,160 | $1,160 | $0 |
| 2021 | $75 | $1,160 | $1,160 | $0 |
| 2020 | $81 | $1,120 | $1,120 | $0 |
| 2019 | $71 | $1,120 | $1,120 | $0 |
| 2018 | $72 | $1,120 | $1,120 | $0 |
| 2017 | $85 | $1,230 | $1,230 | $0 |
| 2016 | $770 | $1,230 | $1,230 | $0 |
| 2015 | $91 | $1,230 | $1,230 | $0 |
| 2014 | $359 | $1,470 | $1,470 | $0 |
| 2013 | $179 | $1,470 | $1,470 | $0 |
Source: Public Records
Map
Nearby Homes
- 811 Troy Place NW
- 806 Troy Place NW
- 905 High Ave NW
- 824 12th St NW
- 1005 Dewalt Ave NW
- 1007 Dewalt Ave NW
- 1227 Worley Ave NW
- 722 High Ave NW
- 1231 Worley Ave NW
- 1224 Cleveland Ave NW
- 1023 Fulton Rd NW
- 916 6th St NW
- 1221 9th St NW
- 1306 12th St NW
- 1347 Shorb Ave NW
- 1226 Logan Ave NW
- 1015 4th St NW
- 413 Newton Ave NW
- 1405 8th St NW
- 1024 3rd St NW
- 820 Troy Place NW
- 830 Troy Place NW
- 814 Troy Place NW
- 918 Shorb Ave NW
- 924 Shorb Ave NW
- 810 Troy Place NW
- 827 9th St NW
- 823 Troy Place NW
- 910 Shorb Ave NW
- 825 Troy Place NW
- 829 Troy Place NW
- 906 Shorb Ave NW
- 930 Shorb Ave NW
- 815 Troy Place NW
- 819 9th St NW
- 815 9th St NW
- 934 Shorb Ave NW
- 900 Shorb Ave NW
- 811 9th St NW
- 800 Troy Place NW