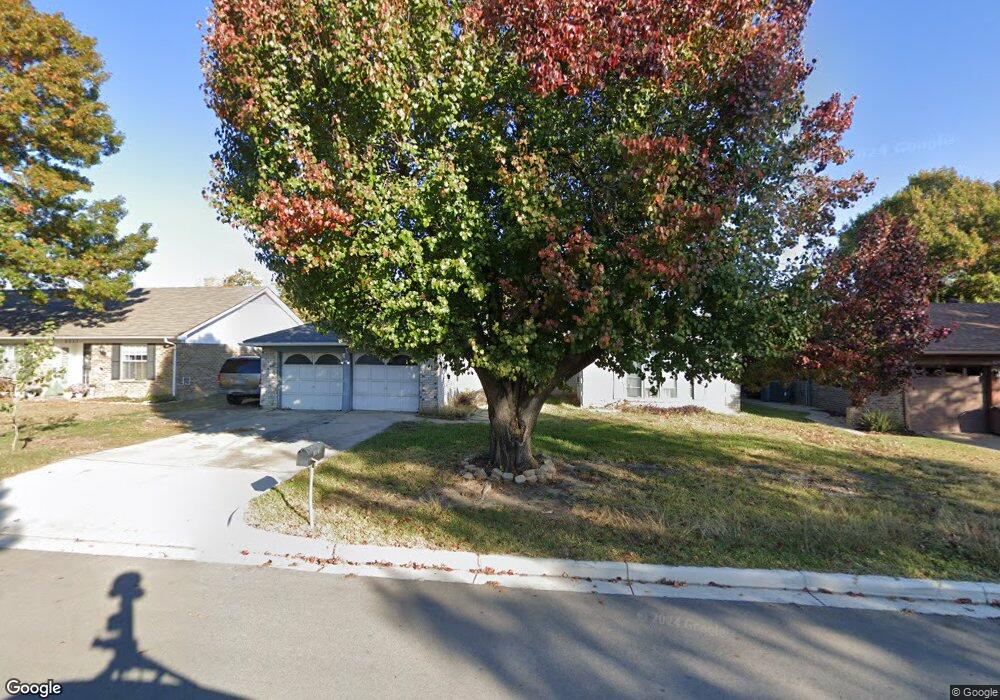
8241 Pearl St North Richland Hills, TX 76180
Estimated Value: $347,059 - $384,000
4
Beds
2
Baths
1,824
Sq Ft
$199/Sq Ft
Est. Value
About This Home
This home is located at 8241 Pearl St, North Richland Hills, TX 76180 and is currently estimated at $362,265, approximately $198 per square foot. 8241 Pearl St is a home located in Tarrant County with nearby schools including Walker Creek Elementary School, Smithfield Middle School, and Birdville High School.
Ownership History
Date
Name
Owned For
Owner Type
Purchase Details
Closed on
Apr 18, 2006
Sold by
Nevin Scott Thomas and Gasch Nevin Lisa Kay
Bought by
Day Gail
Current Estimated Value
Home Financials for this Owner
Home Financials are based on the most recent Mortgage that was taken out on this home.
Original Mortgage
$118,638
Outstanding Balance
$68,059
Interest Rate
6.33%
Mortgage Type
FHA
Estimated Equity
$294,206
Create a Home Valuation Report for This Property
The Home Valuation Report is an in-depth analysis detailing your home's value as well as a comparison with similar homes in the area
Home Values in the Area
Average Home Value in this Area
Purchase History
| Date | Buyer | Sale Price | Title Company |
|---|---|---|---|
| Day Gail | -- | None Available |
Source: Public Records
Mortgage History
| Date | Status | Borrower | Loan Amount |
|---|---|---|---|
| Open | Day Gail | $118,638 |
Source: Public Records
Tax History Compared to Growth
Tax History
| Year | Tax Paid | Tax Assessment Tax Assessment Total Assessment is a certain percentage of the fair market value that is determined by local assessors to be the total taxable value of land and additions on the property. | Land | Improvement |
|---|---|---|---|---|
| 2025 | $3,611 | $315,385 | $60,000 | $255,385 |
| 2024 | $3,611 | $315,385 | $60,000 | $255,385 |
| 2023 | $4,806 | $301,646 | $60,000 | $241,646 |
| 2022 | $4,792 | $274,705 | $35,000 | $239,705 |
| 2021 | $4,607 | $220,744 | $35,000 | $185,744 |
| 2020 | $4,188 | $222,318 | $35,000 | $187,318 |
| 2019 | $3,940 | $223,893 | $35,000 | $188,893 |
| 2018 | $3,099 | $136,028 | $35,000 | $101,028 |
| 2017 | $3,327 | $198,809 | $35,000 | $163,809 |
| 2016 | $3,025 | $172,231 | $15,000 | $157,231 |
| 2015 | $2,437 | $102,200 | $15,000 | $87,200 |
| 2014 | $2,437 | $102,200 | $15,000 | $87,200 |
Source: Public Records
Map
Nearby Homes
- 6250 Shirley Dr
- 6113 Cliffbrook Dr
- 8057 Caladium Dr
- 6137 Marquita Mews
- 6116 Morningside Dr
- 0 Mid Cities Blvd
- 8740 Ice House Dr
- 8321 Bridge St
- 8240 Bridge St
- 8748 Morris Mews
- 8020 Bridge St
- 6017 Avalon St
- 8409 Main St
- 8412 Glenann Dr
- 6008 Monterey Mews
- 8765 Bridge St
- 8409 Glenann Dr
- 8858 Mandalay St
- 7800 Mockingbird Ln Unit 29
- 7800 Mockingbird Ln Unit 81