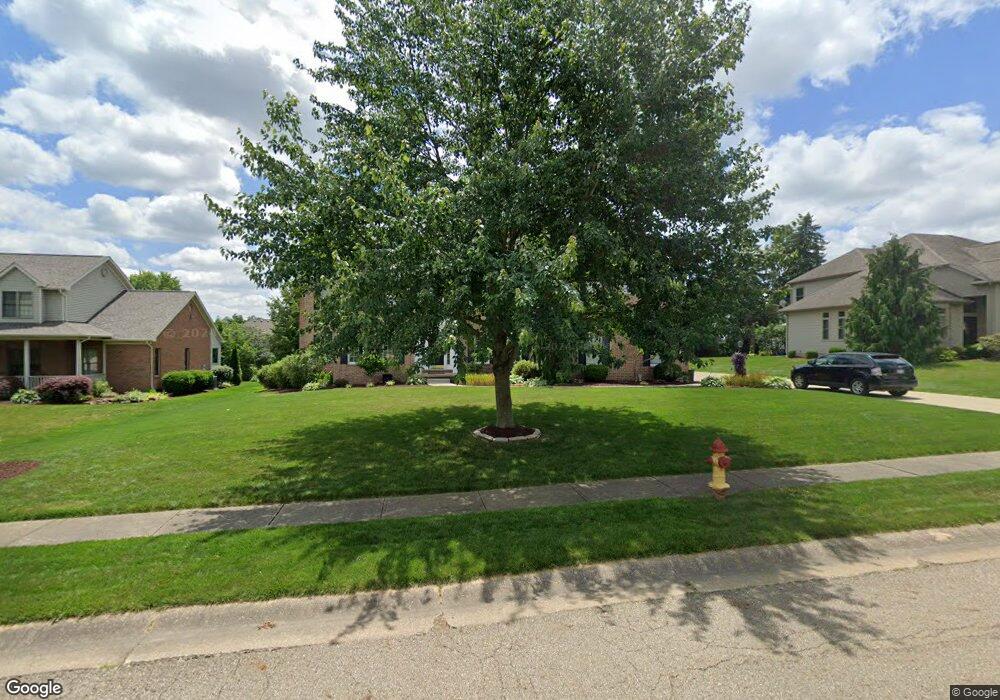
8242 Keswick Court Cir NW Massillon, OH 44646
Amherst Heights-Clearview NeighborhoodEstimated Value: $577,000 - $640,000
5
Beds
4
Baths
3,034
Sq Ft
$198/Sq Ft
Est. Value
About This Home
This home is located at 8242 Keswick Court Cir NW, Massillon, OH 44646 and is currently estimated at $600,303, approximately $197 per square foot. 8242 Keswick Court Cir NW is a home located in Stark County with nearby schools including Sauder Elementary School, Jackson Memorial Middle School, and Jackson High School.
Ownership History
Date
Name
Owned For
Owner Type
Purchase Details
Closed on
Jun 30, 2020
Sold by
Wickemeyer James C and Wickemeyer Nikki P
Bought by
Beese William S and Beese Bridget M
Current Estimated Value
Home Financials for this Owner
Home Financials are based on the most recent Mortgage that was taken out on this home.
Original Mortgage
$150,000
Outstanding Balance
$133,257
Interest Rate
3.2%
Mortgage Type
New Conventional
Estimated Equity
$467,046
Purchase Details
Closed on
Mar 4, 2016
Sold by
Wickemeyer Nikki R
Bought by
Wickemeyer James C and Wickemeyer Nikki R
Home Financials for this Owner
Home Financials are based on the most recent Mortgage that was taken out on this home.
Original Mortgage
$138,600
Interest Rate
3.79%
Mortgage Type
New Conventional
Purchase Details
Closed on
Feb 15, 2005
Sold by
Wickemeyer James C
Bought by
Wickemeyer Nikki R
Purchase Details
Closed on
Jan 7, 1998
Sold by
Stark Investment Co
Bought by
Michael Todd T
Create a Home Valuation Report for This Property
The Home Valuation Report is an in-depth analysis detailing your home's value as well as a comparison with similar homes in the area
Home Values in the Area
Average Home Value in this Area
Purchase History
| Date | Buyer | Sale Price | Title Company |
|---|---|---|---|
| Beese William S | $398,000 | None Available | |
| Wickemeyer James C | -- | None Available | |
| Wickemeyer Nikki R | -- | -- | |
| Michael Todd T | $61,000 | -- |
Source: Public Records
Mortgage History
| Date | Status | Borrower | Loan Amount |
|---|---|---|---|
| Open | Beese William S | $150,000 | |
| Previous Owner | Wickemeyer James C | $138,600 |
Source: Public Records
Tax History Compared to Growth
Tax History
| Year | Tax Paid | Tax Assessment Tax Assessment Total Assessment is a certain percentage of the fair market value that is determined by local assessors to be the total taxable value of land and additions on the property. | Land | Improvement |
|---|---|---|---|---|
| 2025 | -- | $173,710 | $43,610 | $130,100 |
| 2024 | -- | $173,710 | $43,610 | $130,100 |
| 2023 | $7,222 | $143,860 | $36,300 | $107,560 |
| 2022 | $7,172 | $143,860 | $36,300 | $107,560 |
| 2021 | $7,206 | $143,860 | $36,300 | $107,560 |
| 2020 | $6,163 | $113,020 | $31,290 | $81,730 |
| 2019 | $5,936 | $113,020 | $31,290 | $81,730 |
| 2018 | $5,967 | $113,020 | $31,290 | $81,730 |
| 2017 | $6,049 | $109,060 | $28,700 | $80,360 |
| 2016 | $6,088 | $109,060 | $28,700 | $80,360 |
| 2015 | $6,169 | $109,060 | $28,700 | $80,360 |
| 2014 | $105 | $103,260 | $27,200 | $76,060 |
| 2013 | $3,001 | $103,260 | $27,200 | $76,060 |
Source: Public Records
Map
Nearby Homes
- 8028 Clifton Court Cir NW
- 8322 Forest Ridge St NW
- 5679 Carters Grove Cir NW
- 6116 Kirknewton Cir NW
- 7750 Killeen St NW
- 8079 Windward Trace Cir NW
- 7412 Klingston St NW
- 5271 Lake Vista Cir NW
- 8872 Franklin St NW
- 7087 Emerson Cir NW
- 8920 Franklin NW
- 6519 Lorraine Ave NW
- 6541 Lorraine Ave NW
- 6259 Cinderella Ave NW
- 9042 Wolocott St NW
- Asheville Plan at Heritage Park
- Boise Plan at Heritage Park
- 8309 Gentry St NW
- 8932 Franklin St NW
- 6540 Lorraine Ave NW
- 8820 Keswick Court Cir NW
- 8266 Keswick Court Cir NW
- 6212 Old Bridge Ave NW
- 6190 Old Bridge Ave NW
- 6228 Old Bridge Ave NW
- 8243 Keswick Court Cir NW
- 8282 Keswick Court Cir NW
- 8221 Keswick Court Cir NW
- 8267 Keswick Court Cir NW
- 6172 Old Bridge Ave NW
- 5816 Great Court Cir NW
- 8206 Keswick Court Cir NW
- 8283 Keswick Court Cir NW
- 6150 Old Bridge Ave NW
- 8238 Edmund Court Cir NW
- 8254 Edmund Court Cir NW
- 6213 Old Bridge Ave NW
- 8276 Edmund Court Cir NW
- 6191 Old Bridge Ave NW
- 6229 Old Bridge Ave NW