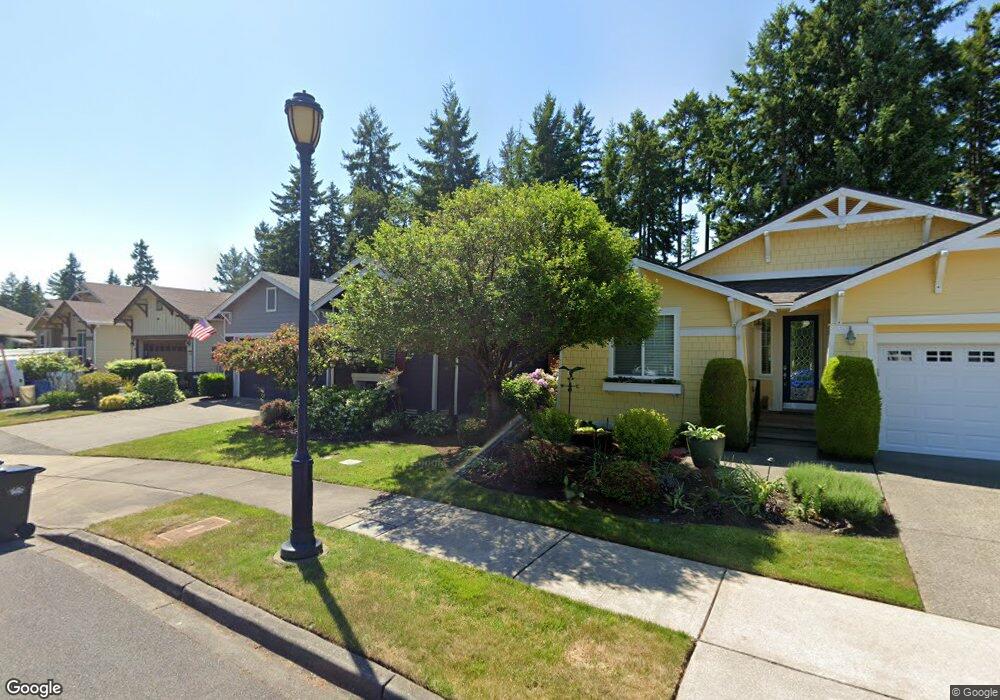
8243 Orcas Loop NE Olympia, WA 98516
Jubilee NeighborhoodEstimated Value: $701,536 - $874,000
2
Beds
2
Baths
1,934
Sq Ft
$396/Sq Ft
Est. Value
About This Home
This home is located at 8243 Orcas Loop NE, Olympia, WA 98516 and is currently estimated at $765,634, approximately $395 per square foot. 8243 Orcas Loop NE is a home with nearby schools including Olympic View Elementary School, Chinook Middle School, and North Thurston High School.
Ownership History
Date
Name
Owned For
Owner Type
Purchase Details
Closed on
Sep 26, 2016
Sold by
Gordon David F and Gordon Sharon L
Bought by
Heatherly Sharilyn D and Heatherly Jake
Current Estimated Value
Purchase Details
Closed on
Apr 1, 2013
Sold by
Ags Jubilee Llc
Bought by
Gordon David E and Gordon Sharon L
Home Financials for this Owner
Home Financials are based on the most recent Mortgage that was taken out on this home.
Original Mortgage
$318,440
Interest Rate
2.87%
Mortgage Type
New Conventional
Purchase Details
Closed on
Jun 23, 2010
Sold by
Hawks Prairie Land Associates Llc
Bought by
Ags Jubilee Llc
Create a Home Valuation Report for This Property
The Home Valuation Report is an in-depth analysis detailing your home's value as well as a comparison with similar homes in the area
Home Values in the Area
Average Home Value in this Area
Purchase History
| Date | Buyer | Sale Price | Title Company |
|---|---|---|---|
| Heatherly Sharilyn D | -- | None Available | |
| Gordon David E | $398,050 | Chicago Title Company | |
| Ags Jubilee Llc | $10,500,000 | First American Title |
Source: Public Records
Mortgage History
| Date | Status | Borrower | Loan Amount |
|---|---|---|---|
| Previous Owner | Gordon David E | $318,440 |
Source: Public Records
Tax History
| Year | Tax Paid | Tax Assessment Tax Assessment Total Assessment is a certain percentage of the fair market value that is determined by local assessors to be the total taxable value of land and additions on the property. | Land | Improvement |
|---|---|---|---|---|
| 2025 | $6,545 | $714,000 | $241,500 | $472,500 |
| 2024 | $6,545 | $699,000 | $235,400 | $463,600 |
| 2023 | $6,545 | $684,900 | $213,900 | $471,000 |
| 2022 | $7,296 | $686,400 | $126,500 | $559,900 |
| 2021 | $6,620 | $627,600 | $113,500 | $514,100 |
| 2020 | $6,464 | $530,500 | $112,400 | $418,100 |
| 2019 | $5,657 | $538,200 | $140,700 | $397,500 |
| 2018 | $6,428 | $479,000 | $133,200 | $345,800 |
| 2017 | $5,430 | $426,600 | $116,800 | $309,800 |
| 2016 | $5,026 | $402,100 | $105,800 | $296,300 |
| 2014 | -- | $385,000 | $105,800 | $279,200 |
Source: Public Records
Map
Nearby Homes
- 8265 Orcas Loop NE
- 8231 Orcas Loop NE
- 8520 Shaw Ln NE
- 4901 Spokane St NE
- 8025 Columbia Way NE
- 4633 Gunvor Ct NE
- 8327 Vashon Dr NE
- 4957 Bend Dr NE
- 4963 Bend Dr NE
- 4986 Meriwood Dr NE
- 4316 Harstene St NE
- 8218 Camano Loop NE
- 4420 Vashon Dr NE
- 4830 Beverly Dr NE
- 8104 52nd Ave NE
- 8602 Vashon Dr NE
- 5209 Junco Ct NE
- 4212 Vashon Dr NE
- 8536 Bainbridge Loop NE Unit 1
- 8650 Bainbridge Loop NE Unit 1
- 8239 Orcas Loop NE
- 8245 Orcas Loop NE
- 8235 Orcas Loop NE
- 8249 Orcas Loop NE
- 8257 Orcas Loop NE
- 8240 Orcas Loop NE
- 8261 Orcas Loop NE
- 8236 Orcas Loop NE
- 8253 Orcas Loop NE
- 8227 Orcas Loop NE
- 8232 Orcas Loop NE
- 8223 Orcas Loop NE
- 8247 Ridgefield Ave NE
- 8243 Ridgefield Ave NE
- 8224 Orcas Loop NE
- 8269 Orcas Loop NE
- 8239 Ridgefield Ave NE
- 8215 Orcas Loop NE
- 8220 Orcas Loop NE
Your Personal Tour Guide
Ask me questions while you tour the home.