Estimated Value: $577,986 - $611,000
3
Beds
3
Baths
1,236
Sq Ft
$480/Sq Ft
Est. Value
About This Home
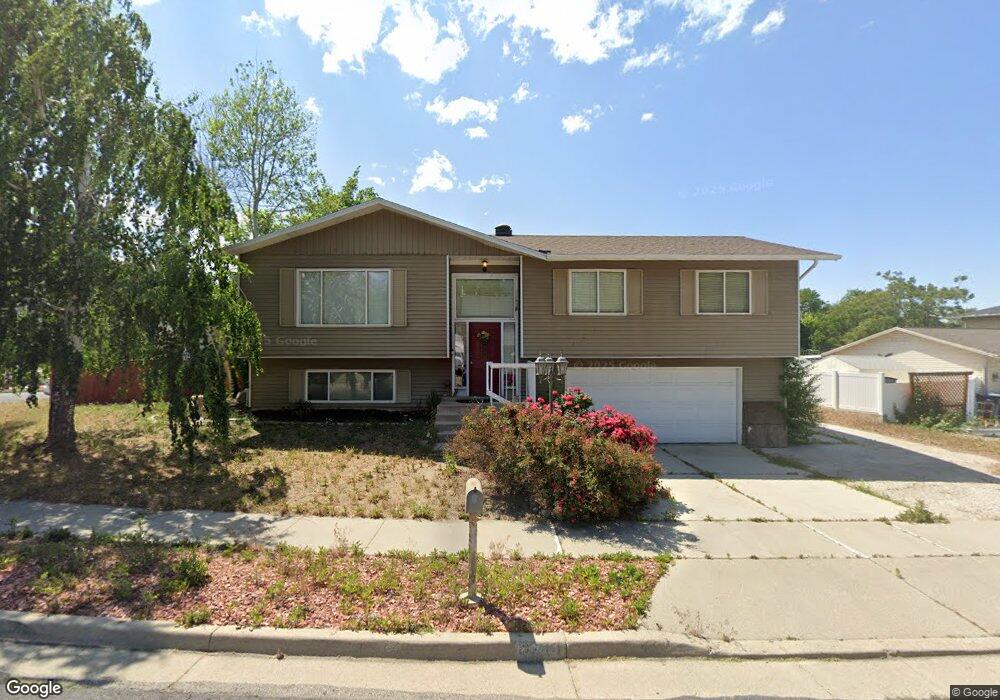
This home is located at 8244 Andorra Ln, Sandy, UT 84093 and is currently estimated at $592,997, approximately $479 per square foot. 8244 Andorra Ln is a home located in Salt Lake County with nearby schools including Peruvian Park Elementary School, Hillcrest High School, and Union Middle School.
Ownership History
Date
Name
Owned For
Owner Type
Purchase Details
Closed on
Feb 27, 2018
Sold by
Allen Jimmy
Bought by
Allen Jimmy
Current Estimated Value
Home Financials for this Owner
Home Financials are based on the most recent Mortgage that was taken out on this home.
Original Mortgage
$180,350
Outstanding Balance
$153,281
Interest Rate
4.04%
Mortgage Type
New Conventional
Estimated Equity
$439,716
Purchase Details
Closed on
May 11, 2011
Sold by
Hudson Tawna Blake
Bought by
Allen Jimmy
Home Financials for this Owner
Home Financials are based on the most recent Mortgage that was taken out on this home.
Original Mortgage
$194,930
Interest Rate
4.62%
Mortgage Type
FHA
Purchase Details
Closed on
Dec 31, 2009
Sold by
Hansen Danny K
Bought by
Sokol Travis and Sokol Angie
Home Financials for this Owner
Home Financials are based on the most recent Mortgage that was taken out on this home.
Original Mortgage
$115,000
Interest Rate
4.78%
Mortgage Type
Seller Take Back
Create a Home Valuation Report for This Property
The Home Valuation Report is an in-depth analysis detailing your home's value as well as a comparison with similar homes in the area
Home Values in the Area
Average Home Value in this Area
Purchase History
| Date | Buyer | Sale Price | Title Company |
|---|---|---|---|
| Allen Jimmy | -- | Artisan Title | |
| Allen Jimmy | -- | Bonneville Superior Title | |
| Sokol Travis | -- | First American Title |
Source: Public Records
Mortgage History
| Date | Status | Borrower | Loan Amount |
|---|---|---|---|
| Open | Allen Jimmy | $180,350 | |
| Closed | Allen Jimmy | $194,930 | |
| Previous Owner | Sokol Travis | $115,000 |
Source: Public Records
Tax History Compared to Growth
Tax History
| Year | Tax Paid | Tax Assessment Tax Assessment Total Assessment is a certain percentage of the fair market value that is determined by local assessors to be the total taxable value of land and additions on the property. | Land | Improvement |
|---|---|---|---|---|
| 2025 | $2,631 | $530,800 | $302,000 | $228,800 |
| 2024 | $2,631 | $493,100 | $290,800 | $202,300 |
| 2023 | $2,616 | $489,400 | $279,600 | $209,800 |
| 2022 | $2,731 | $502,700 | $274,100 | $228,600 |
| 2021 | $2,254 | $353,200 | $210,000 | $143,200 |
| 2020 | $2,250 | $332,800 | $210,000 | $122,800 |
| 2019 | $2,203 | $317,900 | $198,200 | $119,700 |
| 2018 | $2,014 | $303,900 | $198,200 | $105,700 |
| 2017 | $1,941 | $280,200 | $198,200 | $82,000 |
| 2016 | $1,767 | $246,600 | $178,600 | $68,000 |
| 2015 | $1,903 | $246,200 | $189,300 | $56,900 |
| 2014 | $1,849 | $235,000 | $183,900 | $51,100 |
Source: Public Records
Map
Nearby Homes
- 1597 Paulista Way
- 1666 Paulista Way
- 1327 Madrid Way
- 8492 S Mesa Dr
- 1235 E Cottonwood Hills Dr
- 1263 E Cottonwood Hills Dr
- 8638 Piper Ln
- 1169 E Cottonwood Hills Dr Unit 56
- 8149 S Cottonwood Hills Cir Unit 158149
- 1430 E 8685 S
- 1341 E Creek Rd
- 1990 E Terra Vista Way
- 1924 E Viscounti Cove
- 8483 S Terrace Dr
- 7723 Plum Creek Ln
- 7641 Mary Esther Cir
- 8017 S Showcase Ln
- 1077 E 8320 S Unit 18
- 1393 E Galaxie Dr
- 8335 S 1050 E
- 8244 S Andorra Ln
- 1617 Paulista Way
- 8228 Andorra Ln
- 8253 Andorra Ln
- 8253 S Andorra Ln
- 8245 S Andorra Ln Unit 240
- 8245 Andorra Ln Unit 240
- 1628 Paulista Way
- 8231 Andorra Ln
- 1618 Paulista Way
- 1618 E Paulista Way
- 8216 Andorra Ln
- 1607 Paulista Way
- 8216 S Andorra Ln
- 1632 Paulista Way
- 1632 E Paulista Way
- 1608 Paulista Way
- 8221 Andorra Ln
- 1651 Paulista Way
- 1638 Paulista Way