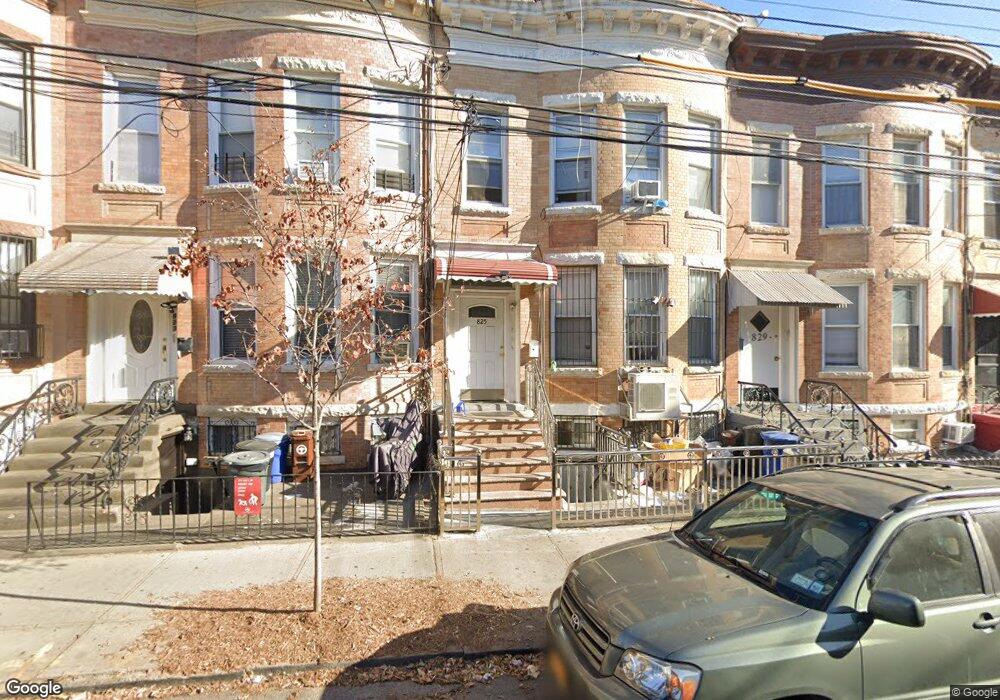
825 41st St Brooklyn, NY 11232
Sunset Park NeighborhoodEstimated Value: $1,333,000 - $1,439,000
--
Bed
--
Bath
1,896
Sq Ft
$725/Sq Ft
Est. Value
About This Home
This home is located at 825 41st St, Brooklyn, NY 11232 and is currently estimated at $1,374,211, approximately $724 per square foot. 825 41st St is a home located in Kings County with nearby schools including P.S. 169 Sunset Park, I.S. 223 The Montauk, and Bnos Margulia Viznitz.
Ownership History
Date
Name
Owned For
Owner Type
Purchase Details
Closed on
Dec 23, 2019
Sold by
Zheng Xiaobao
Bought by
Zheng Sheng Zhi
Current Estimated Value
Purchase Details
Closed on
Dec 15, 2017
Sold by
At Law Of Xin Fan Zheng
Bought by
Zheng Xiaobao
Purchase Details
Closed on
Oct 27, 2010
Sold by
Garcia Carlos
Bought by
Zheng Xiaobao and Zheng Xin Fan
Home Financials for this Owner
Home Financials are based on the most recent Mortgage that was taken out on this home.
Original Mortgage
$170,000
Interest Rate
4.41%
Mortgage Type
Purchase Money Mortgage
Purchase Details
Closed on
Sep 27, 1995
Sold by
Mosio Ryszard
Bought by
Garcia Carlos and Garcia Gloria
Home Financials for this Owner
Home Financials are based on the most recent Mortgage that was taken out on this home.
Original Mortgage
$170,000
Interest Rate
7.71%
Purchase Details
Closed on
Dec 28, 1994
Sold by
Self Reliance Ny Fcu
Bought by
Mosio Riszard and Malyniak Teodor
Create a Home Valuation Report for This Property
The Home Valuation Report is an in-depth analysis detailing your home's value as well as a comparison with similar homes in the area
Home Values in the Area
Average Home Value in this Area
Purchase History
| Date | Buyer | Sale Price | Title Company |
|---|---|---|---|
| Zheng Sheng Zhi | $1,230,000 | -- | |
| Zheng Xiaobao | -- | -- | |
| Zheng Xiaobao | $805,000 | -- | |
| Garcia Carlos | $182,000 | Title Insurance Company | |
| Mosio Riszard | $105,000 | -- |
Source: Public Records
Mortgage History
| Date | Status | Borrower | Loan Amount |
|---|---|---|---|
| Previous Owner | Zheng Xiaobao | $170,000 | |
| Previous Owner | Garcia Carlos | $170,000 |
Source: Public Records
Tax History Compared to Growth
Tax History
| Year | Tax Paid | Tax Assessment Tax Assessment Total Assessment is a certain percentage of the fair market value that is determined by local assessors to be the total taxable value of land and additions on the property. | Land | Improvement |
|---|---|---|---|---|
| 2025 | $6,217 | $80,640 | $22,500 | $58,140 |
| 2024 | $6,217 | $78,480 | $22,500 | $55,980 |
| 2023 | $6,286 | $77,760 | $22,500 | $55,260 |
| 2022 | $5,981 | $69,180 | $22,500 | $46,680 |
| 2021 | $5,948 | $54,120 | $22,500 | $31,620 |
| 2020 | $4,304 | $65,340 | $22,500 | $42,840 |
| 2019 | $5,396 | $67,200 | $22,500 | $44,700 |
| 2018 | $5,258 | $25,795 | $7,009 | $18,786 |
| 2017 | $5,089 | $24,966 | $9,992 | $14,974 |
| 2016 | $4,709 | $23,554 | $10,343 | $13,211 |
| 2015 | $2,841 | $22,767 | $10,176 | $12,591 |
| 2014 | $2,841 | $21,496 | $9,546 | $11,950 |
Source: Public Records
Map
Nearby Homes
- 4018 8th Ave Unit 3
- 4002 8th Ave
- 817 40th St
- 4105 8th Ave
- 759 42nd St Unit 15
- 759 42nd St Unit 12
- 765 42nd St Unit 20
- 772 42nd St
- 761 39th St
- 736 41st St
- 872 41st St
- 719 41st St
- 873 42 St Unit 4C
- 4015 7th Ave Unit 12
- 705 41st St Unit 7
- 3921 7th Ave
- 912 40th St
- 848 43rd St Unit 22
- 3903 7th Ave
- 4317 8th Ave