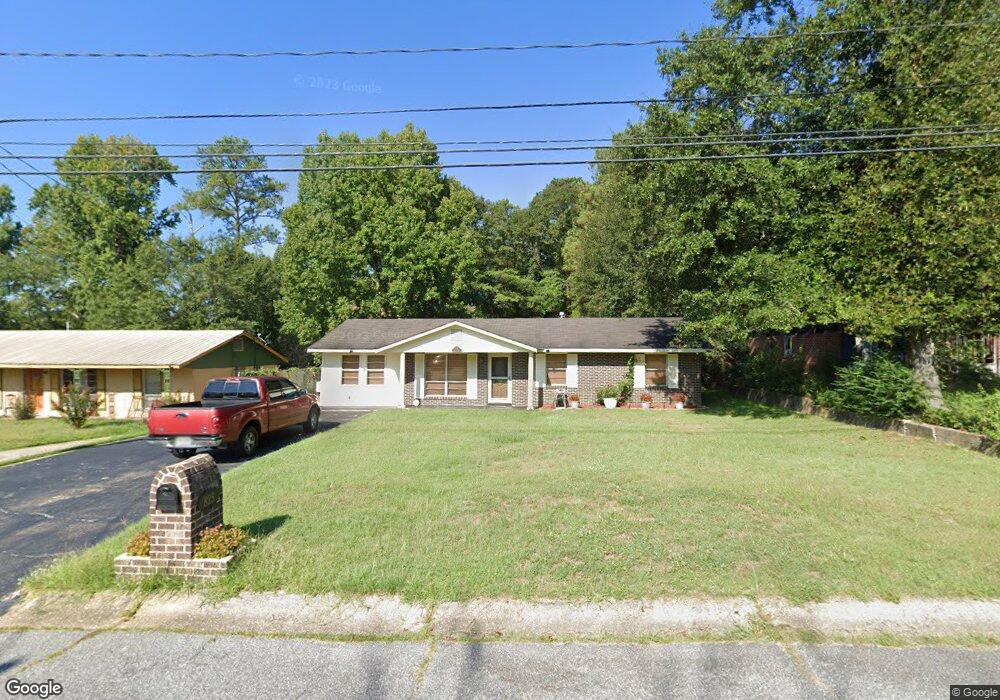
825 Barklay Way Columbus, GA 31907
Estimated Value: $115,000 - $131,846
4
Beds
3
Baths
1,300
Sq Ft
$97/Sq Ft
Est. Value
About This Home
This home is located at 825 Barklay Way, Columbus, GA 31907 and is currently estimated at $126,712, approximately $97 per square foot. 825 Barklay Way is a home located in Muscogee County with nearby schools including Lonnie Jackson Academy, East Columbus Magnet Academy, and Kendrick High School.
Ownership History
Date
Name
Owned For
Owner Type
Purchase Details
Closed on
Mar 14, 2013
Sold by
Sec Of Veterans Affa
Bought by
Sauls John
Current Estimated Value
Home Financials for this Owner
Home Financials are based on the most recent Mortgage that was taken out on this home.
Original Mortgage
$51,806
Interest Rate
3.57%
Mortgage Type
New Conventional
Purchase Details
Closed on
May 1, 2012
Sold by
Gmac Mtg Llc
Bought by
Sec Of Veterans Affairs
Purchase Details
Closed on
Jan 20, 2009
Sold by
Martin Carlos
Bought by
Bertram Wayne Jeffrey and Bertram Patricia
Home Financials for this Owner
Home Financials are based on the most recent Mortgage that was taken out on this home.
Original Mortgage
$110,219
Interest Rate
5.43%
Mortgage Type
VA
Purchase Details
Closed on
Sep 2, 2008
Sold by
Jones Teresa A
Bought by
Martin Carlos
Create a Home Valuation Report for This Property
The Home Valuation Report is an in-depth analysis detailing your home's value as well as a comparison with similar homes in the area
Home Values in the Area
Average Home Value in this Area
Purchase History
| Date | Buyer | Sale Price | Title Company |
|---|---|---|---|
| Sauls John | $60,000 | -- | |
| Sec Of Veterans Affairs | $70,504 | -- | |
| Gmac Mtg Llc | $70,504 | -- | |
| Bertram Wayne Jeffrey | $107,900 | None Available | |
| Martin Carlos | $56,100 | None Available |
Source: Public Records
Mortgage History
| Date | Status | Borrower | Loan Amount |
|---|---|---|---|
| Closed | Sauls John | $51,806 | |
| Previous Owner | Bertram Wayne Jeffrey | $110,219 |
Source: Public Records
Tax History Compared to Growth
Tax History
| Year | Tax Paid | Tax Assessment Tax Assessment Total Assessment is a certain percentage of the fair market value that is determined by local assessors to be the total taxable value of land and additions on the property. | Land | Improvement |
|---|---|---|---|---|
| 2025 | $60 | $43,460 | $6,200 | $37,260 |
| 2024 | $3,744 | $43,460 | $6,200 | $37,260 |
| 2023 | $1,712 | $43,460 | $6,200 | $37,260 |
| 2022 | $1,457 | $35,676 | $6,200 | $29,476 |
| 2021 | $1,639 | $35,676 | $6,200 | $29,476 |
| 2020 | $1,457 | $35,676 | $6,200 | $29,476 |
| 2019 | $1,003 | $24,492 | $6,200 | $18,292 |
| 2018 | $1,003 | $24,492 | $6,200 | $18,292 |
| 2017 | $1,007 | $24,492 | $6,200 | $18,292 |
| 2016 | $990 | $24,000 | $2,887 | $21,113 |
| 2015 | $991 | $24,000 | $2,887 | $21,113 |
| 2014 | $992 | $24,000 | $2,887 | $21,113 |
| 2013 | -- | $42,357 | $2,887 | $39,470 |
Source: Public Records
Map
Nearby Homes
- 822 Reaper Ln
- 736 Belvedere Dr
- 727 Wilder Dr
- 719 Wilder Dr
- 752 Wilder Dr
- 702 Corley Dr
- 4722 Pollman St
- 5526 Buena Vista Rd
- 5532 Buena Vista Rd
- 558 Wilder Dr
- 4906 Pollman St
- 4903 Chapman St
- 5235 Vincent Dr
- 5529 Pollman St
- 4804 Bruning St
- 644 Georgia Dr
- 4935 Buena Vista Rd
- 766 Cardinal Ave
- 4742 Marino St
- 960 Lake Rushin Dr
- 819 Barklay Way
- 831 Barklay Way
- 813 Barklay Way
- 837 Barklay Way
- 812 Mccormick Place
- 807 Barklay Way
- 826 Barklay Way
- 843 Barklay Way
- 820 Barklay Way
- 832 Barklay Way
- 814 Mccormick Place
- 808 Mccormick Place
- 814 Barklay Way
- 838 Barklay Way
- 808 Barklay Way
- 801 Barklay Way
- 849 Barklay Way
- 844 Barklay Way
- 802 Mccormick Place
- 802 Barklay Way