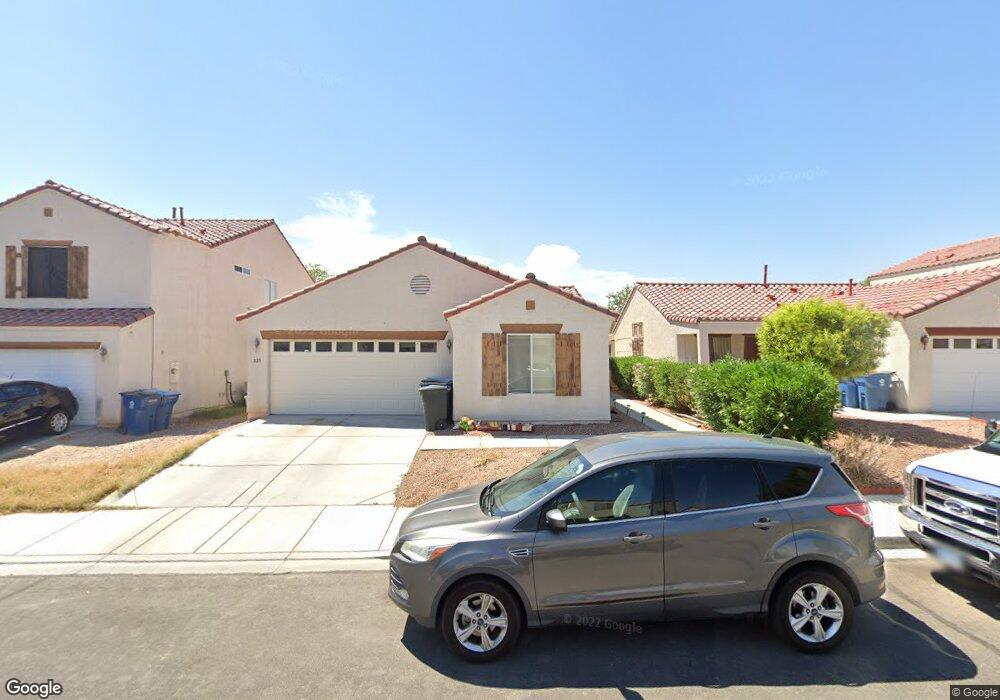
825 Bladensburg St Unit 2 Las Vegas, NV 89110
East Las Vegas NeighborhoodEstimated Value: $270,000 - $368,000
3
Beds
2
Baths
1,335
Sq Ft
$251/Sq Ft
Est. Value
About This Home
This home is located at 825 Bladensburg St Unit 2, Las Vegas, NV 89110 and is currently estimated at $334,501, approximately $250 per square foot. 825 Bladensburg St Unit 2 is a home located in Clark County with nearby schools including Ira J Earl Elementary School, Dell H Robison Middle School, and Eldorado High School.
Ownership History
Date
Name
Owned For
Owner Type
Purchase Details
Closed on
Jan 31, 2017
Sold by
Indian Creek Solution Llc
Bought by
Series Iii Of Indian Creek Solutions Llc
Current Estimated Value
Purchase Details
Closed on
Sep 28, 2005
Sold by
Waldman Carol A
Bought by
Indian Creek Solutions Llc
Purchase Details
Closed on
Mar 24, 2004
Sold by
Jackson Steven C and Jackson Catherine M
Bought by
Waldman Carol A
Home Financials for this Owner
Home Financials are based on the most recent Mortgage that was taken out on this home.
Original Mortgage
$95,900
Interest Rate
4.33%
Purchase Details
Closed on
May 30, 2001
Sold by
Washington Development Llc
Bought by
Jackson Steven C and Jackson Catherina M
Home Financials for this Owner
Home Financials are based on the most recent Mortgage that was taken out on this home.
Original Mortgage
$130,232
Interest Rate
7.15%
Mortgage Type
VA
Create a Home Valuation Report for This Property
The Home Valuation Report is an in-depth analysis detailing your home's value as well as a comparison with similar homes in the area
Home Values in the Area
Average Home Value in this Area
Purchase History
| Date | Buyer | Sale Price | Title Company |
|---|---|---|---|
| Series Iii Of Indian Creek Solutions Llc | -- | None Available | |
| Indian Creek Solutions Llc | -- | -- | |
| Waldman Carol A | $153,900 | Fidelity National Title | |
| Jackson Steven C | $127,679 | Land Title |
Source: Public Records
Mortgage History
| Date | Status | Borrower | Loan Amount |
|---|---|---|---|
| Previous Owner | Waldman Carol A | $95,900 | |
| Previous Owner | Jackson Steven C | $130,232 |
Source: Public Records
Tax History Compared to Growth
Tax History
| Year | Tax Paid | Tax Assessment Tax Assessment Total Assessment is a certain percentage of the fair market value that is determined by local assessors to be the total taxable value of land and additions on the property. | Land | Improvement |
|---|---|---|---|---|
| 2025 | $1,284 | $86,724 | $26,950 | $59,774 |
| 2024 | $1,189 | $86,724 | $26,950 | $59,774 |
| 2023 | $1,189 | $84,450 | $28,000 | $56,450 |
| 2022 | $1,101 | $74,748 | $23,100 | $51,648 |
| 2021 | $1,020 | $69,704 | $20,650 | $49,054 |
| 2020 | $944 | $67,515 | $18,900 | $48,615 |
| 2019 | $885 | $63,006 | $15,050 | $47,956 |
| 2018 | $844 | $57,769 | $11,550 | $46,219 |
| 2017 | $1,879 | $57,331 | $10,500 | $46,831 |
| 2016 | $792 | $40,237 | $7,000 | $33,237 |
| 2015 | $789 | $34,727 | $7,000 | $27,727 |
| 2014 | $764 | $22,619 | $4,200 | $18,419 |
Source: Public Records
Map
Nearby Homes
- 854 Stainglass Ln
- 4565 Halbert Ave
- 724 Concrete Ct
- 621 Sponseller St
- 729 Concrete Ct
- 4612 Soda Ash Ave
- 886 Slumpstone Way
- 875 Ripple Way
- 1009 Greenbank St
- 825 N Lamb Blvd Unit 147
- 825 N Lamb Blvd Unit 92
- 825 N Lamb Blvd Unit 162
- 825 N Lamb Blvd Unit 74
- 825 N Lamb Blvd Unit 131
- 825 N Lamb Blvd Unit 158
- 825 N Lamb Blvd Unit 202
- 825 N Lamb Blvd Unit 53
- 825 N Lamb Blvd Unit 34
- 825 N Lamb Blvd Unit 335
- 825 N Lamb Blvd Unit 84
- 829 Bladensburg St
- 821 Bladensburg St
- 833 Bladensburg St
- 826 Hyattsville St
- 822 Hyattsville St
- 830 Hyattsville St
- 818 Hyattsville St
- 837 Bladensburg St
- 813 Bladensburg St
- 813 Bladensburg St Unit None
- 834 Hyattsville St
- 822 Bladensburg St
- 818 Bladensburg St
- 814 Hyattsville St
- 830 Bladensburg St
- 830 Bladensburg St Unit n/a
- 826 Bladensburg St
- 838 Hyattsville St
- 841 Bladensburg St
- 809 Bladensburg St