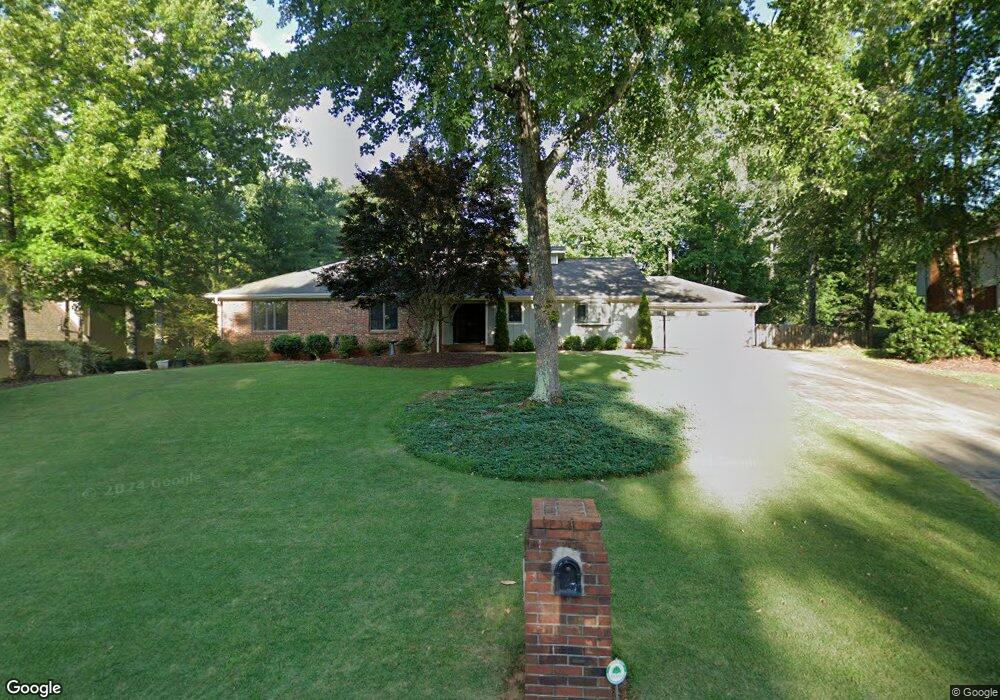
825 Ferncroft Ct Roswell, GA 30075
Brookfield West NeighborhoodEstimated Value: $784,000 - $913,000
4
Beds
3
Baths
2,432
Sq Ft
$343/Sq Ft
Est. Value
About This Home
This home is located at 825 Ferncroft Ct, Roswell, GA 30075 and is currently estimated at $834,511, approximately $343 per square foot. 825 Ferncroft Ct is a home located in Fulton County with nearby schools including Mountain Park Elementary School, Crabapple Middle School, and Fellowship Christian School.
Ownership History
Date
Name
Owned For
Owner Type
Purchase Details
Closed on
Mar 5, 2010
Sold by
National Residl Nominee Svcs
Bought by
Poole William J and Poole Julie P
Current Estimated Value
Home Financials for this Owner
Home Financials are based on the most recent Mortgage that was taken out on this home.
Original Mortgage
$321,567
Outstanding Balance
$218,591
Interest Rate
5.5%
Mortgage Type
FHA
Estimated Equity
$615,920
Purchase Details
Closed on
Dec 24, 2009
Sold by
Kimble Jamie D and Kimble Alyssa D
Bought by
National Residl Nominee Svcs
Purchase Details
Closed on
Jun 25, 2008
Sold by
Caille Gary W and Caille Janet J
Bought by
Kimble Jamie D and Kimble Alyssa D
Home Financials for this Owner
Home Financials are based on the most recent Mortgage that was taken out on this home.
Original Mortgage
$294,400
Interest Rate
5.96%
Mortgage Type
New Conventional
Purchase Details
Closed on
Jul 1, 1996
Sold by
Binkley Barbara J
Bought by
Caille Gary W
Create a Home Valuation Report for This Property
The Home Valuation Report is an in-depth analysis detailing your home's value as well as a comparison with similar homes in the area
Home Values in the Area
Average Home Value in this Area
Purchase History
| Date | Buyer | Sale Price | Title Company |
|---|---|---|---|
| Poole William J | $327,500 | -- | |
| National Residl Nominee Svcs | $39,300 | -- | |
| Kimble Jamie D | $368,000 | -- | |
| Caille Gary W | $207,500 | -- |
Source: Public Records
Mortgage History
| Date | Status | Borrower | Loan Amount |
|---|---|---|---|
| Open | Poole William J | $321,567 | |
| Previous Owner | Kimble Jamie D | $294,400 | |
| Closed | Caille Gary W | $0 |
Source: Public Records
Tax History Compared to Growth
Tax History
| Year | Tax Paid | Tax Assessment Tax Assessment Total Assessment is a certain percentage of the fair market value that is determined by local assessors to be the total taxable value of land and additions on the property. | Land | Improvement |
|---|---|---|---|---|
| 2025 | $961 | $298,760 | $67,440 | $231,320 |
| 2023 | $8,149 | $288,720 | $106,160 | $182,560 |
| 2022 | $4,152 | $245,120 | $43,960 | $201,160 |
| 2021 | $4,882 | $175,000 | $38,280 | $136,720 |
| 2020 | $4,853 | $161,880 | $44,440 | $117,440 |
| 2019 | $766 | $168,280 | $46,360 | $121,920 |
| 2018 | $4,298 | $164,360 | $45,280 | $119,080 |
| 2017 | $3,957 | $147,560 | $29,960 | $117,600 |
| 2016 | $3,956 | $147,560 | $29,960 | $117,600 |
| 2015 | $4,777 | $147,560 | $29,960 | $117,600 |
| 2014 | $3,664 | $132,280 | $38,640 | $93,640 |
Source: Public Records
Map
Nearby Homes
- 865 Ferncroft Ct
- 570 Wheatridge Bluff
- 870 Hickory Oak Hollow
- 1005 Hedgerose Ln
- 680 Brookfield Pkwy Unit 1
- 125 Fortuna Ct
- 5210 Davenport Place
- 3412 Waters Edge Trail
- 2512 Waters Edge Trail Unit 2512
- 5407 Waters Edge Trail
- 2404 Village Ln Unit 2404
- 1111 Waters Edge Trail
- 1460 Lakemist Ct
- 4201 Village Green Dr
- 4405 Village Green Dr
- 11850 Chaffin Rd
- 2010 Stonehedge Rd
- 150 Flowing Spring Trail Unit 4
- 345 Chaffin Ridge Ct
- 0 Ferncroft Ct Unit 7332479
- 0 Ferncroft Ct Unit 8113896
- 0 Ferncroft Ct Unit 8169089
- 0 Ferncroft Ct Unit 7112355
- 0 Ferncroft Ct Unit 3149225
- 0 Ferncroft Ct
- 815 Ferncroft Ct
- 305 Ferncrest Place
- 510 Willow View Way
- 840 Ferncroft Ct
- 850 Ferncroft Ct
- 315 Ferncrest Place
- 805 Ferncroft Ct
- 520 Willow View Way
- 855 Ferncroft Ct
- 820 Ferncroft Ct Unit 18
- 415 Timber Crest Ln Unit 18
- 1060 Mountain Ivy Dr
- 870 Ferncroft Ct Unit 18
- 310 Ferncrest Place