825 Hancock St Abington, MA 02351
Estimated Value: $544,000 - $582,000
About This Home
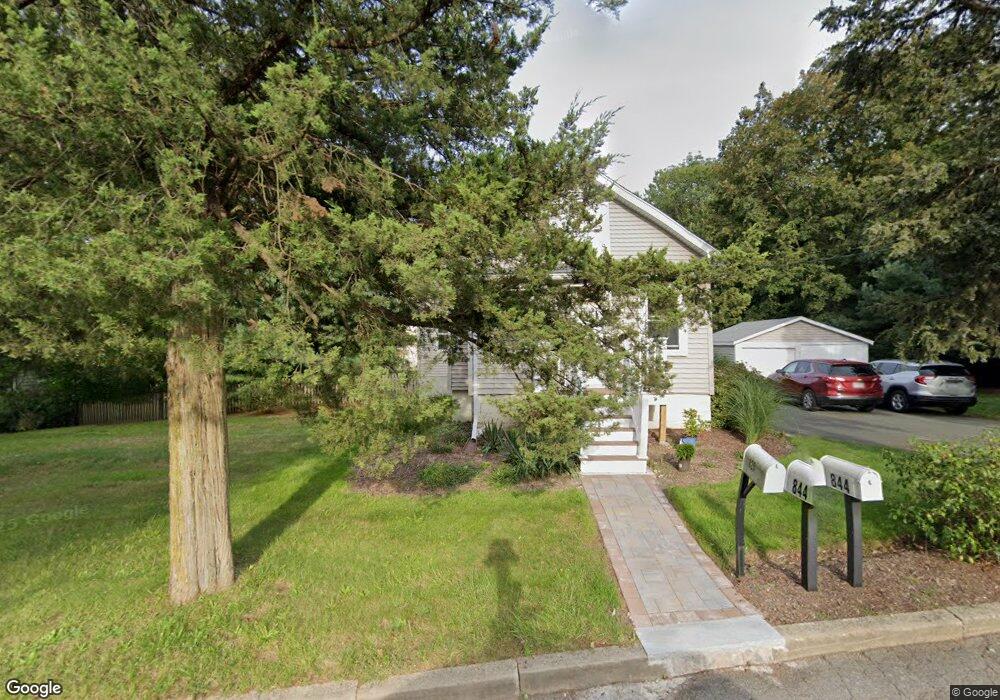
This home is located at 825 Hancock St, Abington, MA 02351 and is currently estimated at $561,053, approximately $353 per square foot. 825 Hancock St is a home located in Plymouth County with nearby schools including Woodsdale School, Beaver Brook Elementary School, and Abington Middle School.
Ownership History
We collect this data history from publicly available records. To have your information removed, we recommend requesting removal directly through your county’s website.
Purchase Details
Purchase Details
Home Values in the Area
Average Home Value in this Area
Purchase History
We collect this data history from publicly available records. To have your information removed, we recommend requesting removal directly through your county’s website.
| Date | Buyer | Sale Price | Title Company |
|---|---|---|---|
| $149,900 | -- | ||
| $82,000 | -- |
Mortgage History
We collect this data history from publicly available records. To have your information removed, we recommend requesting removal directly through your county’s website.
| Date | Status | Borrower | Loan Amount |
|---|---|---|---|
| Open | $291,552 | ||
| Closed | $38,157 |
Tax History
We collect this data history from publicly available records. To have your information removed, we recommend requesting removal directly through your county’s website.
| Year | Tax Paid | Tax Assessment Tax Assessment Total Assessment is a certain percentage of the fair market value that is determined by local assessors to be the total taxable value of land and additions on the property. | Land | Improvement |
|---|---|---|---|---|
| 2025 | $6,053 | $463,500 | $242,200 | $221,300 |
| 2024 | $6,293 | $470,300 | $220,500 | $249,800 |
| 2023 | $5,977 | $420,600 | $192,100 | $228,500 |
| 2022 | $6,042 | $397,000 | $168,500 | $228,500 |
| 2021 | $2,924 | $334,600 | $153,100 | $181,500 |
| 2020 | $5,610 | $330,000 | $148,500 | $181,500 |
| 2019 | $5,200 | $299,000 | $141,600 | $157,400 |
| 2018 | $386 | $279,200 | $141,600 | $137,600 |
| 2017 | $4,923 | $268,300 | $141,600 | $126,700 |
| 2016 | $4,441 | $247,700 | $135,000 | $112,700 |
| 2015 | $4,260 | $250,600 | $135,000 | $115,600 |
Map
- 221 Chestnut St
- 895 Hancock St
- 10 Kingswood Dr Unit 13
- 6 Kingswood Dr Unit B11
- 36 Blanchard Terrace
- 600 Randolph St
- 373 Hancock St
- 26 Crabtree Ln
- 22 Nardone Cir
- 214 Presidential Dr
- 354 Sycamore St
- 640 Plymouth St
- 138 Malinda Dr
- 299 N Quincy St Unit 1
- 299 N Quincy St Unit 3
- 299 N Quincy St Unit 2
- 1148 Bedford St
- 1065 Bedford St
- 717 Hampton Way
- 170 Thicket St
- 835 Hancock St
- 807 Hancock St
- 176 Chestnut St
- 195 Chestnut St
- 195 Chestnut St Unit 1
- 844 Hancock St
- 193B Chestnut St Unit 3
- 193 Chestnut St
- 193 Chestnut St Unit 3
- 193 Chestnut St Unit 2
- 193 Chestnut St Unit 193 B
- 863 Hancock St
- 160 Chestnut St
- 200 Chestnut St
- 824 Hancock St
- 852 Hancock St
- 875 Hancock St
- 205 Chestnut St
- 159 Chestnut St
- 148 Chestnut St
Ask me questions while you tour the home.