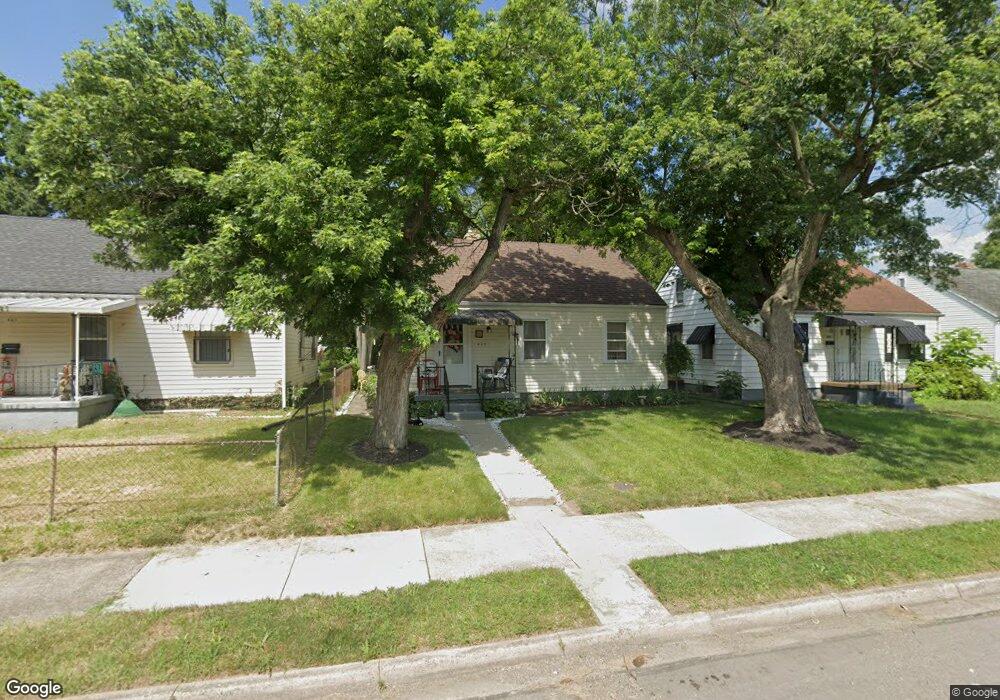
825 Huron Ave Dayton, OH 45402
Westwood NeighborhoodEstimated Value: $53,659 - $81,000
2
Beds
1
Bath
750
Sq Ft
$86/Sq Ft
Est. Value
About This Home
This home is located at 825 Huron Ave, Dayton, OH 45402 and is currently estimated at $64,415, approximately $85 per square foot. 825 Huron Ave is a home located in Montgomery County with nearby schools including International School at Residence Park, Westwood Elementary, and Louise Troy Elementary.
Ownership History
Date
Name
Owned For
Owner Type
Purchase Details
Closed on
Jul 5, 2018
Sold by
Davidson Ann Powel
Bought by
Blackwell Margarett
Current Estimated Value
Purchase Details
Closed on
Jun 17, 2016
Sold by
Buckhanon Kent O
Bought by
Davidson Ann Powell
Purchase Details
Closed on
Dec 29, 2004
Sold by
J Port Inc
Bought by
Performance Home Buyers Llc
Purchase Details
Closed on
Nov 4, 2003
Sold by
J Port Inc
Bought by
Clark Sharmikia K
Home Financials for this Owner
Home Financials are based on the most recent Mortgage that was taken out on this home.
Original Mortgage
$49,000
Interest Rate
9%
Mortgage Type
Seller Take Back
Purchase Details
Closed on
May 18, 2000
Sold by
Dirksen Irene R
Bought by
J Port Inc
Purchase Details
Closed on
Apr 19, 2000
Sold by
Dirksen Irene R
Bought by
J Port Inc
Purchase Details
Closed on
Oct 19, 1999
Sold by
Dirksen Irene R
Bought by
J Port Inc
Create a Home Valuation Report for This Property
The Home Valuation Report is an in-depth analysis detailing your home's value as well as a comparison with similar homes in the area
Home Values in the Area
Average Home Value in this Area
Purchase History
| Date | Buyer | Sale Price | Title Company |
|---|---|---|---|
| Blackwell Margarett | -- | None Available | |
| Davidson Ann Powell | $13,700 | None Available | |
| Performance Home Buyers Llc | -- | None Available | |
| Clark Sharmikia K | $49,900 | -- | |
| J Port Inc | $16,350 | -- | |
| J Port Inc | $16,350 | -- | |
| J Port Inc | -- | -- |
Source: Public Records
Mortgage History
| Date | Status | Borrower | Loan Amount |
|---|---|---|---|
| Previous Owner | Clark Sharmikia K | $49,000 |
Source: Public Records
Tax History Compared to Growth
Tax History
| Year | Tax Paid | Tax Assessment Tax Assessment Total Assessment is a certain percentage of the fair market value that is determined by local assessors to be the total taxable value of land and additions on the property. | Land | Improvement |
|---|---|---|---|---|
| 2024 | $23 | $7,620 | $2,070 | $5,550 |
| 2023 | $23 | $7,620 | $2,070 | $5,550 |
| 2022 | $23 | $6,630 | $1,800 | $4,830 |
| 2021 | $23 | $6,630 | $1,800 | $4,830 |
| 2020 | $23 | $6,630 | $1,800 | $4,830 |
| 2019 | $34 | $7,930 | $1,800 | $6,130 |
| 2018 | $668 | $7,930 | $1,800 | $6,130 |
| 2017 | $663 | $7,930 | $1,800 | $6,130 |
| 2016 | $504 | $4,770 | $1,800 | $2,970 |
| 2015 | $1,193 | $4,770 | $1,800 | $2,970 |
| 2014 | $1,193 | $8,030 | $1,800 | $6,230 |
| 2012 | -- | $8,210 | $2,940 | $5,270 |
Source: Public Records
Map
Nearby Homes
- 936 Walton Ave
- 24 Edith St
- 728 Leland Ave
- 733 Leland Ave
- 2929 Hoover Ave
- 548 Huron Ave
- 550 Brooklyn Ave
- 3602 Hoover Ave Unit 3600
- 1209 Kammer Ave
- 2712 Hoover Ave
- 1251 Canfield Ave
- 532 Crestmore Ave
- 927 Maplehurst Ave
- 524 Crestmore Ave
- 1419 Lexington Ave
- 1045 Philadelphia Dr
- 830 Bedford Ave
- 320 Huron Ave
- 1365 Alcott Dr
- 400 Walton Ave