Estimated Value: $146,832 - $187,000
3
Beds
3
Baths
1,376
Sq Ft
$123/Sq Ft
Est. Value
About This Home
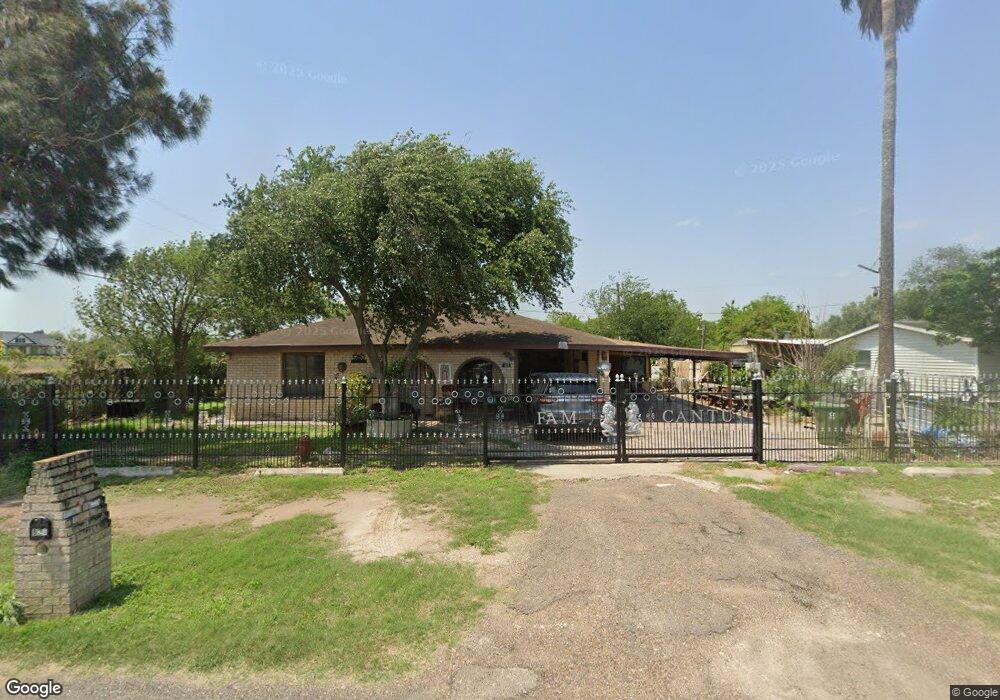
This home is located at 825 Park Rd, Alamo, TX 78516 and is currently estimated at $169,708, approximately $123 per square foot. 825 Park Rd is a home located in Hidalgo County with nearby schools including Capt. D. Salinas Elementary School, A.P. Solis Middle School, and Donna High School.
Ownership History
Date
Name
Owned For
Owner Type
Purchase Details
Closed on
Jan 17, 2024
Sold by
Cantu Leonel Rodriguez
Bought by
Pruneda Hipolito Cantu
Current Estimated Value
Purchase Details
Closed on
Sep 17, 2018
Sold by
Buena Tierra Development Inc
Bought by
Cantu Maria Guadalupe Pruneda De
Home Financials for this Owner
Home Financials are based on the most recent Mortgage that was taken out on this home.
Original Mortgage
$29,450
Interest Rate
4.6%
Mortgage Type
Purchase Money Mortgage
Create a Home Valuation Report for This Property
The Home Valuation Report is an in-depth analysis detailing your home's value as well as a comparison with similar homes in the area
Home Values in the Area
Average Home Value in this Area
Purchase History
| Date | Buyer | Sale Price | Title Company |
|---|---|---|---|
| Pruneda Hipolito Cantu | -- | None Listed On Document | |
| Cantu Maria Guadalupe Pruneda De | -- | None Available |
Source: Public Records
Mortgage History
| Date | Status | Borrower | Loan Amount |
|---|---|---|---|
| Previous Owner | Cantu Maria Guadalupe Pruneda De | $29,450 |
Source: Public Records
Tax History Compared to Growth
Tax History
| Year | Tax Paid | Tax Assessment Tax Assessment Total Assessment is a certain percentage of the fair market value that is determined by local assessors to be the total taxable value of land and additions on the property. | Land | Improvement |
|---|---|---|---|---|
| 2025 | $576 | $162,517 | $44,494 | $118,023 |
| 2024 | $576 | $84,356 | -- | -- |
| 2023 | $1,524 | $76,687 | $0 | $0 |
| 2022 | $1,427 | $69,715 | $0 | $0 |
| 2021 | $1,310 | $63,377 | $22,247 | $55,457 |
| 2020 | $1,241 | $57,615 | $22,247 | $48,649 |
| 2019 | $1,145 | $52,377 | $17,798 | $34,579 |
| 2018 | $1,149 | $52,377 | $17,798 | $34,579 |
| 2017 | $1,155 | $52,377 | $17,798 | $34,579 |
| 2016 | $1,107 | $50,218 | $17,798 | $32,420 |
| 2015 | $927 | $50,218 | $17,798 | $32,420 |
Source: Public Records
Map
Nearby Homes