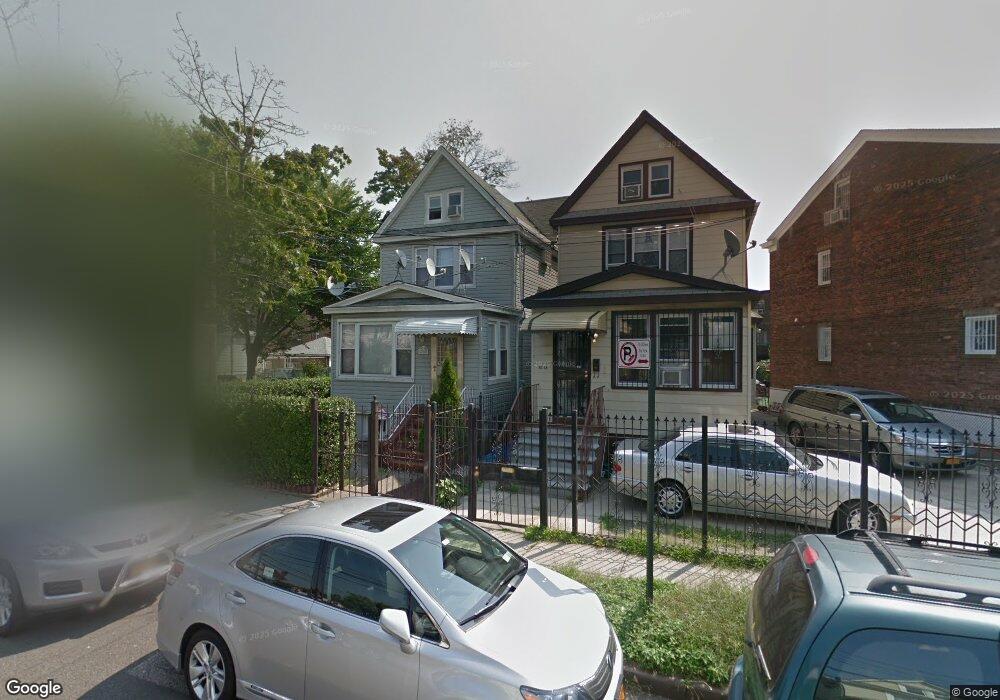
8250 Saint James Ave Elmhurst, NY 11373
Elmhurst NeighborhoodEstimated Value: $1,069,343 - $1,434,000
--
Bed
--
Bath
1,944
Sq Ft
$634/Sq Ft
Est. Value
About This Home
This home is located at 8250 Saint James Ave, Elmhurst, NY 11373 and is currently estimated at $1,233,336, approximately $634 per square foot. 8250 Saint James Ave is a home located in Queens County with nearby schools including P.S. 7 Louis F Simeone, Is 5 The Walter Crowley Intermediate School, and Newtown High School.
Ownership History
Date
Name
Owned For
Owner Type
Purchase Details
Closed on
Oct 11, 2016
Sold by
Flores Edmund S
Bought by
Lin Xiang Ri and Lin Mei Juan
Current Estimated Value
Home Financials for this Owner
Home Financials are based on the most recent Mortgage that was taken out on this home.
Original Mortgage
$594,000
Outstanding Balance
$475,900
Interest Rate
3.44%
Mortgage Type
New Conventional
Estimated Equity
$757,436
Purchase Details
Closed on
Aug 3, 2005
Sold by
Flores Edmund S and Flores Rizalina
Bought by
Flores Edmund S
Purchase Details
Closed on
Mar 19, 1997
Sold by
Napfel Josephine and Napfel Ferdinand
Bought by
Flores Edmund S and Flores Rizalina
Home Financials for this Owner
Home Financials are based on the most recent Mortgage that was taken out on this home.
Original Mortgage
$180,000
Interest Rate
7.77%
Create a Home Valuation Report for This Property
The Home Valuation Report is an in-depth analysis detailing your home's value as well as a comparison with similar homes in the area
Home Values in the Area
Average Home Value in this Area
Purchase History
| Date | Buyer | Sale Price | Title Company |
|---|---|---|---|
| Lin Xiang Ri | $990,000 | -- | |
| Lin Xiang Ri | $990,000 | -- | |
| Flores Edmund S | -- | -- | |
| Flores Edmund S | -- | -- | |
| Flores Edmund S | $200,000 | First American Title Ins Co | |
| Flores Edmund S | $200,000 | First American Title Ins Co |
Source: Public Records
Mortgage History
| Date | Status | Borrower | Loan Amount |
|---|---|---|---|
| Open | Lin Xiang Ri | $594,000 | |
| Closed | Lin Xiang Ri | $594,000 | |
| Previous Owner | Flores Edmund S | $180,000 | |
| Closed | Flores Edmund S | $0 |
Source: Public Records
Tax History Compared to Growth
Tax History
| Year | Tax Paid | Tax Assessment Tax Assessment Total Assessment is a certain percentage of the fair market value that is determined by local assessors to be the total taxable value of land and additions on the property. | Land | Improvement |
|---|---|---|---|---|
| 2025 | $8,676 | $45,786 | $13,426 | $32,360 |
| 2024 | $8,676 | $43,195 | $12,711 | $30,484 |
| 2023 | $8,396 | $41,803 | $11,324 | $30,479 |
| 2022 | $8,067 | $61,620 | $20,040 | $41,580 |
| 2021 | $8,504 | $60,540 | $20,040 | $40,500 |
| 2020 | $8,076 | $60,360 | $20,040 | $40,320 |
| 2019 | $7,530 | $58,560 | $20,040 | $38,520 |
| 2018 | $7,101 | $34,836 | $11,765 | $23,071 |
| 2017 | $6,864 | $33,674 | $12,552 | $21,122 |
| 2016 | $6,732 | $33,674 | $12,552 | $21,122 |
| 2015 | $3,612 | $31,796 | $15,583 | $16,213 |
| 2014 | $3,612 | $29,997 | $17,095 | $12,902 |
Source: Public Records
Map
Nearby Homes
- 83-01 Saint James Ave
- 82-19 Queens Blvd
- 82-25 Queens Blvd
- 82-25 Queens Blvd Unit 2C
- 84-20 51st Ave Unit 6H
- 84-20 51st Ave Unit 2M
- 84-20 51st Ave Unit 5L
- 84-20 51st Ave Unit 5C
- 84-19 51st Ave Unit 5
- 84-19 51st Ave Unit 2E
- 84-19 51st Ave Unit 4E
- 84-19 51st Ave Unit 6
- 84-19 51st Ave Unit 1P
- 8420 51st Ave Unit 2E
- 83-34 Dongan Ave
- 8337 Saint James Ave Unit 3S
- 83-37 Saint James Ave Unit 2R
- 83-37 Saint James Ave Unit 5L
- 84-09 Queens Blvd Unit 4B
- 84-09 Queens Blvd Unit 4A
- 8250 Saint James Ave
- 8248 Saint James Ave
- 8242 Saint James Ave
- 8242 Saint James Ave
- 8238 Saint James Ave
- 8302 Saint James Ave
- 8304 Saint James Ave
- 8304 Saint James Ave
- 8257 51st Ave
- 8236 Saint James Ave
- 82-57A 51st Ave
- 8247 Saint James Ave
- 8255 51st Ave
- 8245 Saint James Ave
- 8259 51st Ave
- 8257A 51st Ave
- 8308 Saint James Ave
- 8251 51st Ave
- 5011 Poyer St
- 8243 Saint James Ave