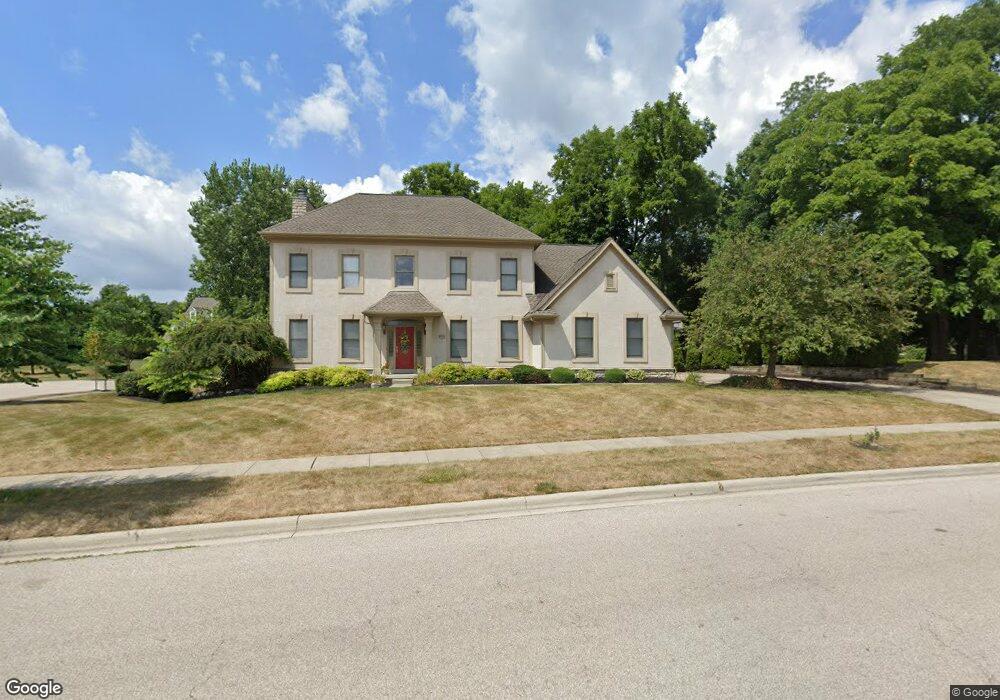
8251 Chippenham Dr Dublin, OH 43016
Estimated Value: $859,582 - $1,082,000
5
Beds
5
Baths
3,161
Sq Ft
$302/Sq Ft
Est. Value
About This Home
This home is located at 8251 Chippenham Dr, Dublin, OH 43016 and is currently estimated at $954,646, approximately $302 per square foot. 8251 Chippenham Dr is a home located in Franklin County with nearby schools including Albert Chapman Elementary School, Ann Simpson Davis Middle School, and Dublin Scioto High School.
Ownership History
Date
Name
Owned For
Owner Type
Purchase Details
Closed on
Feb 9, 2025
Sold by
Capel David R
Bought by
Capel Jamie S
Current Estimated Value
Purchase Details
Closed on
Jun 18, 2004
Sold by
Mauger Thomas F and Laxson Leah
Bought by
Capel David R and Capel Jamie S
Home Financials for this Owner
Home Financials are based on the most recent Mortgage that was taken out on this home.
Original Mortgage
$200,000
Interest Rate
6.46%
Mortgage Type
Purchase Money Mortgage
Purchase Details
Closed on
Jun 26, 2001
Sold by
Minton David E and Minton Pattie
Bought by
Mauger Thomas F
Purchase Details
Closed on
Jun 8, 2001
Sold by
Marcinick Gary J and Marcinick David E
Bought by
Barone Joseph J
Purchase Details
Closed on
Jun 10, 1999
Sold by
Jeffrey R Yocca Builder Inc
Bought by
Minton David E and Minton Pattie
Home Financials for this Owner
Home Financials are based on the most recent Mortgage that was taken out on this home.
Original Mortgage
$425,049
Interest Rate
6.99%
Create a Home Valuation Report for This Property
The Home Valuation Report is an in-depth analysis detailing your home's value as well as a comparison with similar homes in the area
Home Values in the Area
Average Home Value in this Area
Purchase History
We collect this data history from publicly available records. To have your information removed, we recommend requesting removal directly through your county’s website.
| Date | Buyer | Sale Price | Title Company |
|---|---|---|---|
| Capel Jamie S | -- | None Listed On Document | |
| Capel David R | $492,000 | Independent | |
| Mauger Thomas F | $445,000 | Midland Celtic Title | |
| Barone Joseph J | -- | Chicago Title | |
| Minton David E | $425,100 | Christopher Land Title Inc |
Source: Public Records
Mortgage History
We collect this data history from publicly available records. To have your information removed, we recommend requesting removal directly through your county’s website.
| Date | Status | Borrower | Loan Amount |
|---|---|---|---|
| Previous Owner | Capel David R | $200,000 | |
| Previous Owner | Minton David E | $425,049 |
Source: Public Records
Tax History
| Year | Tax Paid | Tax Assessment Tax Assessment Total Assessment is a certain percentage of the fair market value that is determined by local assessors to be the total taxable value of land and additions on the property. | Land | Improvement |
|---|---|---|---|---|
| 2025 | $14,310 | $220,260 | $59,500 | $160,760 |
| 2024 | $14,310 | $220,260 | $59,500 | $160,760 |
| 2023 | $14,112 | $220,255 | $59,500 | $160,755 |
| 2022 | $12,190 | $173,920 | $46,200 | $127,720 |
| 2021 | $12,220 | $173,920 | $46,200 | $127,720 |
| 2020 | $12,321 | $173,920 | $46,200 | $127,720 |
| 2019 | $12,653 | $157,960 | $42,000 | $115,960 |
| 2018 | $6,353 | $157,960 | $42,000 | $115,960 |
| 2017 | $11,775 | $157,960 | $42,000 | $115,960 |
| 2016 | $12,202 | $153,690 | $32,730 | $120,960 |
| 2015 | $6,140 | $153,690 | $32,730 | $120,960 |
| 2014 | $12,296 | $153,690 | $32,730 | $120,960 |
| 2013 | $5,957 | $146,335 | $31,150 | $115,185 |
Source: Public Records
Map
Nearby Homes
- 7985 Riverside Dr
- 7818 Silver Rose Ct
- 4409 Wyandotte Woods Blvd
- 8119 Glencree Place
- 10542 Wellington Blvd
- 4506 N Hampton Dr
- 4840 Paddington Way
- 3910 Summit View Rd
- 10669 Riverside Dr
- 4933 Emerald Lakes Blvd Unit 4903
- 5000 Deer Run Dr
- 4931 Drymen Ct
- 5732 Dunnwood Ct
- 10417 Cambridge Place
- 5137 Chaffinch Ct
- 4298 Weybridge Ct
- 3954 Delwood Dr
- 7402 Riverside Dr
- 10217 Braemar Dr
- 8403 Beeswing Ct
- 4603 Sandwich Ct
- 4609 Lyme Ct
- 8252 Chippenham Dr
- 8243 Chippenham Dr
- 4618 Lyme Ct
- 8260 Chippenham Dr
- 8244 Chippenham Dr
- 4619 Sandwich Ct
- 22 Sandwich Ct
- 8268 Chippenham Dr
- 8236 Chippenham Dr
- 8221 Millhouse Ln
- 8235 Chippenham Dr
- 4602 Sandwich Ct
- 4610 Sandwich Ct
- 8229 Millhouse Ln
- 8276 Chippenham Dr
- 4618 Sandwich Ct
- 8237 Millhouse Ln
- 4618 Gwynedd Ct
Your Personal Tour Guide
Ask me questions while you tour the home.