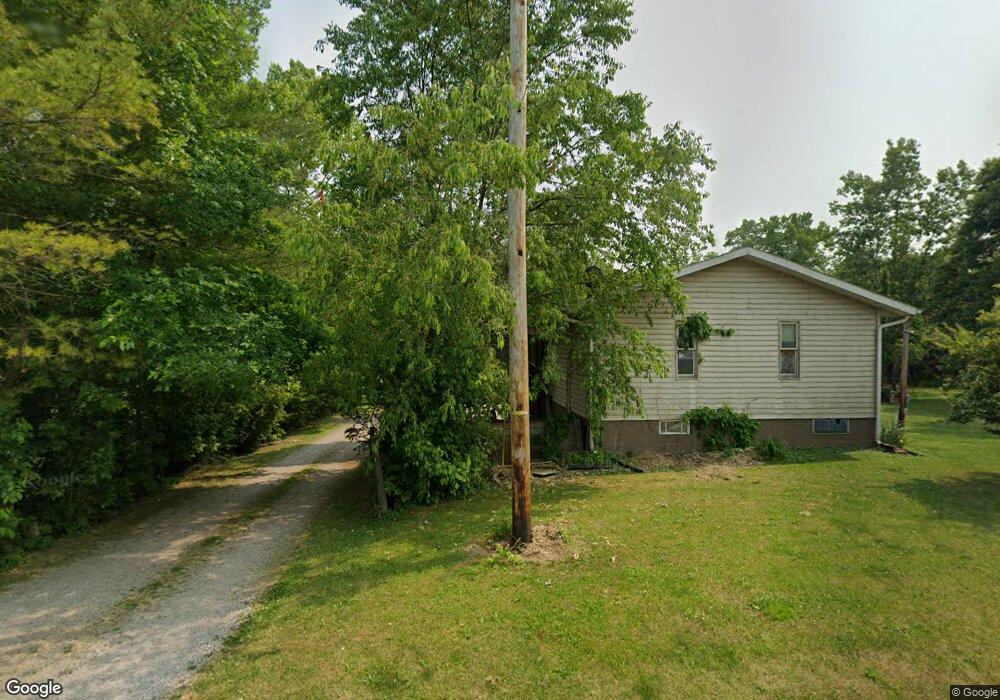
8251 Main St NE New Lexington, OH 43764
Estimated Value: $120,916 - $242,000
2
Beds
1
Bath
960
Sq Ft
$191/Sq Ft
Est. Value
About This Home
This home is located at 8251 Main St NE, New Lexington, OH 43764 and is currently estimated at $183,479, approximately $191 per square foot. 8251 Main St NE is a home located in Perry County with nearby schools including New Lexington Elementary School, Junction City Elementary School, and New Lexington Middle School.
Ownership History
Date
Name
Owned For
Owner Type
Purchase Details
Closed on
Jan 31, 2025
Sold by
Savage Terry R
Bought by
Bailey Hunter L
Current Estimated Value
Purchase Details
Closed on
May 12, 2023
Sold by
Dutiel Ronald F
Bought by
Savage Terry
Purchase Details
Closed on
Oct 29, 2013
Sold by
Dutiel Louella M
Bought by
Dutiel Ronald F
Create a Home Valuation Report for This Property
The Home Valuation Report is an in-depth analysis detailing your home's value as well as a comparison with similar homes in the area
Home Values in the Area
Average Home Value in this Area
Purchase History
| Date | Buyer | Sale Price | Title Company |
|---|---|---|---|
| Bailey Hunter L | $20,000 | None Listed On Document | |
| Bailey Hunter L | $20,000 | None Listed On Document | |
| Savage Terry | $40,000 | None Listed On Document | |
| Dutiel Ronald F | -- | None Available |
Source: Public Records
Tax History Compared to Growth
Tax History
| Year | Tax Paid | Tax Assessment Tax Assessment Total Assessment is a certain percentage of the fair market value that is determined by local assessors to be the total taxable value of land and additions on the property. | Land | Improvement |
|---|---|---|---|---|
| 2024 | $1,057 | $30,460 | $2,740 | $27,720 |
| 2023 | $1,055 | $30,460 | $2,740 | $27,720 |
| 2022 | $1,116 | $29,920 | $2,180 | $27,740 |
| 2021 | $1,116 | $29,920 | $2,180 | $27,740 |
| 2020 | $1,110 | $29,920 | $2,180 | $27,740 |
| 2019 | $967 | $26,090 | $2,070 | $24,020 |
| 2018 | $966 | $26,090 | $2,070 | $24,020 |
| 2017 | $864 | $26,090 | $2,070 | $24,020 |
| 2016 | $778 | $20,930 | $810 | $20,120 |
| 2015 | $778 | $20,930 | $810 | $20,120 |
| 2014 | $730 | $20,930 | $810 | $20,120 |
| 2013 | $6,415 | $20,930 | $810 | $20,120 |
| 2012 | -- | $20,930 | $810 | $20,120 |
Source: Public Records
Map
Nearby Homes
- 7882 State Route 669 NE
- 7705 Ohio 345
- 9660 Old Rainer Rd
- 0 Ohio 669
- 9758 Wesley Chapel Rd
- 3773 State Route 345 NE
- 9945 Wesley Chapel 47 Rd
- 10294 Township Road 57 NE
- 0 Township Road 51
- Township Rd 51
- Township Rd 51
- Township Rd 51
- Township Rd 51
- 6045 Township Road 173 NE
- 419 N Buckeye St
- Township Rd 51
- Township Rd 51
- Township Rd 51
- Township Rd 51
- 8257 Main St NE
- 8230 Main St NE
- 8240 Main St NE
- 6943 Park St NE
- 6943 Main St
- 6935 Park St NE
- 6935 Park St NE
- 8180 Main St NE
- 6975 Park St NE
- 6885 Oak St NE
- 6956 Park St NE
- 8329 Valley St NE
- 8375 Main St NE
- 8312 Valley St
- 6979 Park St NE
- 6985 Park St NE
- 6962 Oak St NE
- 6840 Township Road 154 NE
- 6965 Oak St NE
- 8259 Park St