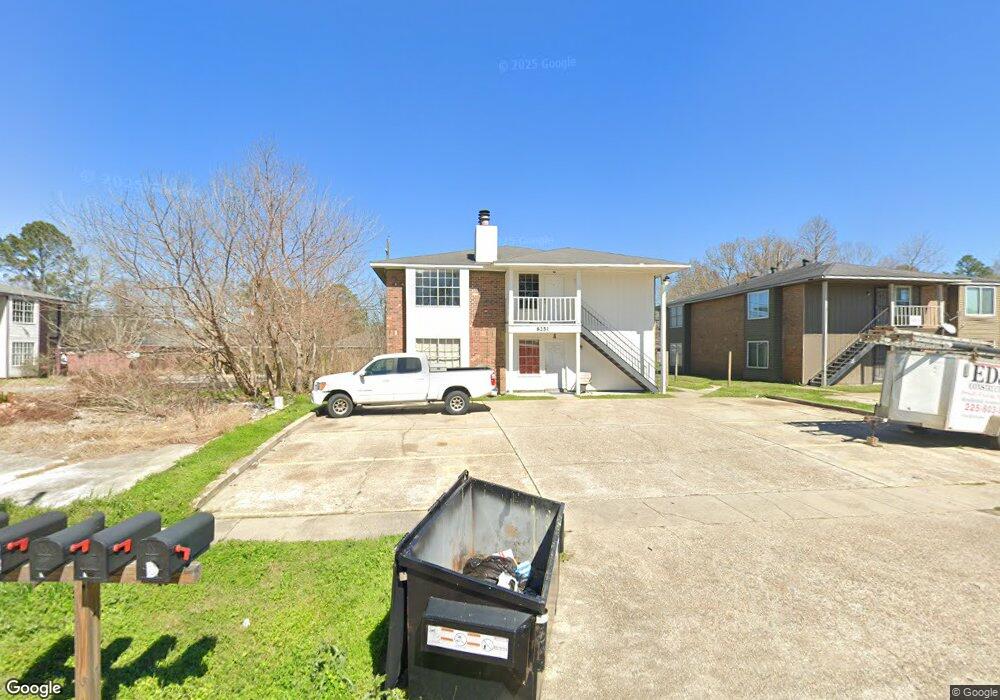
8251 Ned Ave Unit D Baton Rouge, LA 70820
Highlands/Perkins NeighborhoodEstimated Value: $207,000 - $229,737
2
Beds
2
Baths
976
Sq Ft
$224/Sq Ft
Est. Value
About This Home
This home is located at 8251 Ned Ave Unit D, Baton Rouge, LA 70820 and is currently estimated at $218,684, approximately $224 per square foot. 8251 Ned Ave Unit D is a home located in East Baton Rouge Parish with nearby schools including Highland Elementary School, Glasgow Middle School, and Mckinley Senior High School.
Ownership History
Date
Name
Owned For
Owner Type
Purchase Details
Closed on
Oct 29, 2024
Sold by
Mikhael George E
Bought by
Th3c Llc
Current Estimated Value
Purchase Details
Closed on
Feb 22, 2021
Sold by
Myers James J and Myers Tracy D
Bought by
Mikhael George E
Home Financials for this Owner
Home Financials are based on the most recent Mortgage that was taken out on this home.
Original Mortgage
$153,750
Interest Rate
2.7%
Mortgage Type
New Conventional
Purchase Details
Closed on
Aug 1, 2016
Sold by
Business First Bank
Bought by
Myers James J
Purchase Details
Closed on
Jan 16, 2008
Sold by
W Chimes Place L L C
Bought by
Omega Investment
Home Financials for this Owner
Home Financials are based on the most recent Mortgage that was taken out on this home.
Original Mortgage
$200,000
Interest Rate
5.94%
Mortgage Type
New Conventional
Create a Home Valuation Report for This Property
The Home Valuation Report is an in-depth analysis detailing your home's value as well as a comparison with similar homes in the area
Home Values in the Area
Average Home Value in this Area
Purchase History
| Date | Buyer | Sale Price | Title Company |
|---|---|---|---|
| Th3c Llc | $209,500 | Stewart Title Guaranty Company | |
| Mikhael George E | $205,000 | Preferred Title Company | |
| Myers James J | $80,000 | Security Title Guarantee | |
| Omega Investment | $130,000 | -- |
Source: Public Records
Mortgage History
| Date | Status | Borrower | Loan Amount |
|---|---|---|---|
| Previous Owner | Mikhael George E | $153,750 | |
| Previous Owner | Omega Investment | $200,000 |
Source: Public Records
Tax History Compared to Growth
Tax History
| Year | Tax Paid | Tax Assessment Tax Assessment Total Assessment is a certain percentage of the fair market value that is determined by local assessors to be the total taxable value of land and additions on the property. | Land | Improvement |
|---|---|---|---|---|
| 2024 | $2,429 | $19,450 | $4,000 | $15,450 |
| 2023 | $2,429 | $19,450 | $4,000 | $15,450 |
| 2022 | $2,383 | $19,450 | $4,000 | $15,450 |
| 2021 | $1,081 | $8,360 | $1,320 | $7,040 |
| 2020 | $1,072 | $8,360 | $1,320 | $7,040 |
| 2019 | $1,333 | $10,250 | $1,200 | $9,050 |
| 2018 | $1,317 | $10,250 | $1,200 | $9,050 |
| 2017 | $1,317 | $10,250 | $1,200 | $9,050 |
| 2016 | $1,287 | $10,250 | $1,200 | $9,050 |
| 2015 | $1,257 | $10,000 | $1,200 | $8,800 |
| 2014 | $1,232 | $10,000 | $1,200 | $8,800 |
| 2013 | -- | $10,000 | $1,200 | $8,800 |
Source: Public Records
Map
Nearby Homes
- 8245 Ned Ave
- 8261 Ned Ave
- 8231 Ned Ave
- 8271 Ned Ave
- 1767 Port Dr
- 1725 Starboard Dr
- 8138 Keel Ave
- 8347 Amy Dr
- 2041-2043 Helm Dr Unit 2
- 2010-2012 Helm Dr
- 2030-2032 Helm Dr Unit 2
- 1485 Alouette Dr
- 8521 Rush Ave
- 8602 Edgewater Dr
- 8740 Edgewater Dr
- 8612 Rush Ave
- 8256 Rocky Trail Ave
- 9031 Crosscreek Ave
- 1139 Drago Dr
- Baldwin Plan at Pelican Lakes
- 8251 Ned Ave Unit B
- 8245 Ned Ave Unit B
- 8255 Ned Ave
- 8255 Ned Ave Unit D (MF Board)
- 8255 Ned Ave Unit C
- 8255 Ned Ave Unit B
- 8255 Ned Ave Unit D
- 8235 Ned Ave
- 8265 Ned Ave
- 8250 Ned Ave
- 8246 Ned Ave
- 8256 Ned Ave
- 7204 Rolling Fork Rd
- 7240 Rolling Fork Rd
- 7204 Rolling Fork Rd
- 7222 Rolling Fork Rd
- 8240 Ned Ave
- 8260 Ned Ave
- 8270 Stern Ave
- 8272 Stern Ave