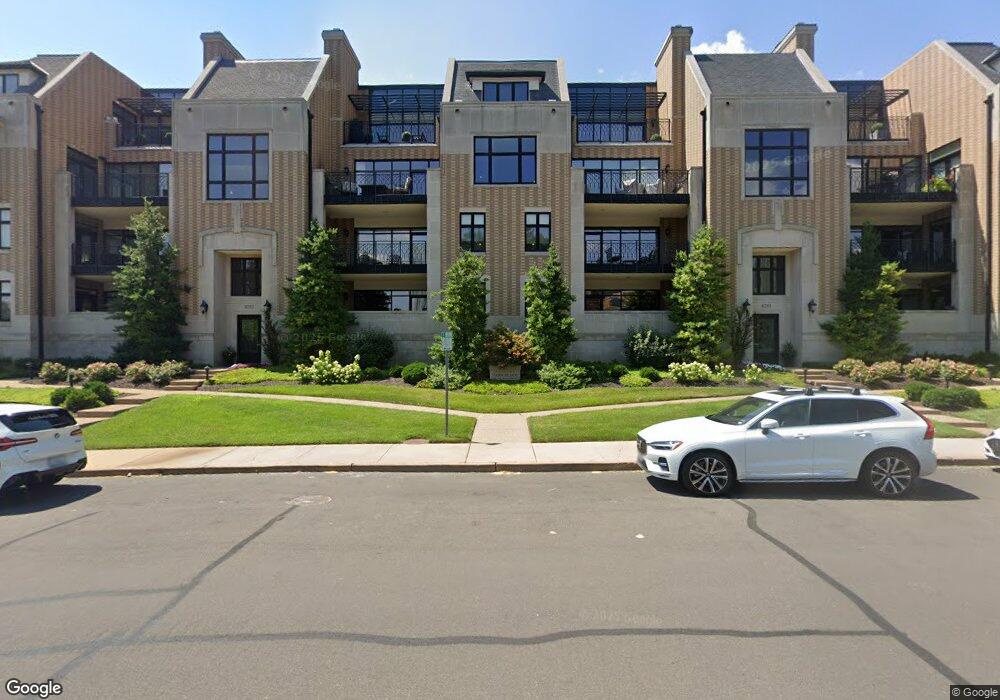
8251 Parkside Dr Unit 4G Saint Louis, MO 63105
Downtown Clayton NeighborhoodEstimated Value: $1,691,000 - $1,959,000
3
Beds
3
Baths
3,635
Sq Ft
$513/Sq Ft
Est. Value
About This Home
This home is located at 8251 Parkside Dr Unit 4G, Saint Louis, MO 63105 and is currently estimated at $1,865,293, approximately $513 per square foot. 8251 Parkside Dr Unit 4G is a home located in St. Louis County with nearby schools including Meramec Elementary, Wydown Middle School, and Clayton High School.
Ownership History
Date
Name
Owned For
Owner Type
Purchase Details
Closed on
Aug 27, 2020
Sold by
Sneider Martin K and Sneider Jill F
Bought by
Martin K And Jill F Sneider Spousal Trust and Sneider
Current Estimated Value
Purchase Details
Closed on
Dec 29, 2008
Sold by
R J York Park Place Llc
Bought by
Sneider Martin K and Sneider Jill F
Home Financials for this Owner
Home Financials are based on the most recent Mortgage that was taken out on this home.
Original Mortgage
$417,000
Interest Rate
6.08%
Mortgage Type
Purchase Money Mortgage
Purchase Details
Closed on
Apr 6, 2006
Sold by
Wilkinson Edmund W
Bought by
R J York Park Place Llc
Purchase Details
Closed on
Dec 22, 1999
Sold by
Wjr Wilkinson Edmund
Bought by
Wilkinson Edmund W and Edmund W Wilkinson Jr Revocable Living T
Create a Home Valuation Report for This Property
The Home Valuation Report is an in-depth analysis detailing your home's value as well as a comparison with similar homes in the area
Home Values in the Area
Average Home Value in this Area
Purchase History
| Date | Buyer | Sale Price | Title Company |
|---|---|---|---|
| Martin K And Jill F Sneider Spousal Trust | -- | None Listed On Document | |
| Martin K And Jill F Sneider Spousal Trust | -- | None Listed On Document | |
| Sneider Martin K | $2,846,735 | U S Title | |
| R J York Park Place Llc | $1,850,000 | None Available | |
| Wilkinson Edmund W | -- | -- |
Source: Public Records
Mortgage History
| Date | Status | Borrower | Loan Amount |
|---|---|---|---|
| Previous Owner | Sneider Martin K | $417,000 |
Source: Public Records
Tax History Compared to Growth
Tax History
| Year | Tax Paid | Tax Assessment Tax Assessment Total Assessment is a certain percentage of the fair market value that is determined by local assessors to be the total taxable value of land and additions on the property. | Land | Improvement |
|---|---|---|---|---|
| 2025 | $21,419 | $348,770 | $104,980 | $243,790 |
| 2024 | $21,419 | $315,210 | $72,520 | $242,690 |
| 2023 | $21,419 | $315,210 | $72,520 | $242,690 |
| 2022 | $19,460 | $271,170 | $87,020 | $184,150 |
| 2021 | $19,391 | $271,170 | $87,020 | $184,150 |
| 2020 | $21,103 | $285,910 | $87,020 | $198,890 |
| 2019 | $20,820 | $285,910 | $87,020 | $198,890 |
| 2018 | $18,880 | $263,800 | $53,180 | $210,620 |
| 2017 | $18,755 | $263,800 | $53,180 | $210,620 |
| 2016 | $17,608 | $235,880 | $53,180 | $182,700 |
| 2015 | $17,763 | $235,880 | $53,180 | $182,700 |
| 2014 | $18,876 | $240,770 | $190,530 | $50,240 |
Source: Public Records
Map
Nearby Homes
- 10 Brighton Way Unit 1
- 23 Brighton Way Unit 100
- 8250 Forsyth Blvd Unit 109
- 8250 Forsyth Blvd Unit 303
- 8250 Forsyth Blvd Unit 402
- 8250 Forsyth Blvd Unit 408
- 8250 Forsyth Blvd Unit 405
- 8250 Forsyth Blvd Unit 210
- 8250 Forsyth Blvd Unit 103
- 8250 Forsyth Blvd Unit 209
- 8250 Forsyth Blvd Unit 404
- 8250 Forsyth Blvd Unit 105
- 8250 Forsyth Blvd Unit 208
- 8250 Forsyth Blvd Unit 401
- 8250 Forsyth Blvd Unit 310
- 8250 Forsyth Blvd Unit 107
- 8250 Forsyth Blvd Unit 406
- 8250 Forsyth Blvd Unit 403
- 8250 Forsyth Blvd Unit 104
- 8250 Forsyth Blvd Unit 407
- 8251 Parkside Dr Unit 3D
- 8251 Parkside Dr Unit 3C
- 8251 Parkside Dr Unit 2C
- 8251 Parkside Dr Unit 1D
- 8251 Parkside Dr Unit 1C
- 8251 Parkside Dr Unit C3
- 8251 Parkside Dr Unit C-1
- 8251 Parkside Dr Unit D1
- 8253 Parkside Dr Unit 4F
- 8253 Parkside Dr Unit 3B
- 8253 Parkside Dr Unit 3A
- 8253 Parkside Dr Unit 2B
- 8253 Parkside Dr Unit 2A
- 8253 Parkside Dr Unit 1B
- 8253 Parkside Dr Unit 1A
- 8253 Parkside Dr Unit B3
- 8253 Parkside Dr Unit A3
- 8253 Parkside Dr Unit B2
- 8253 Parkside Dr Unit A1
- 8253 Parkside Dr Unit B1