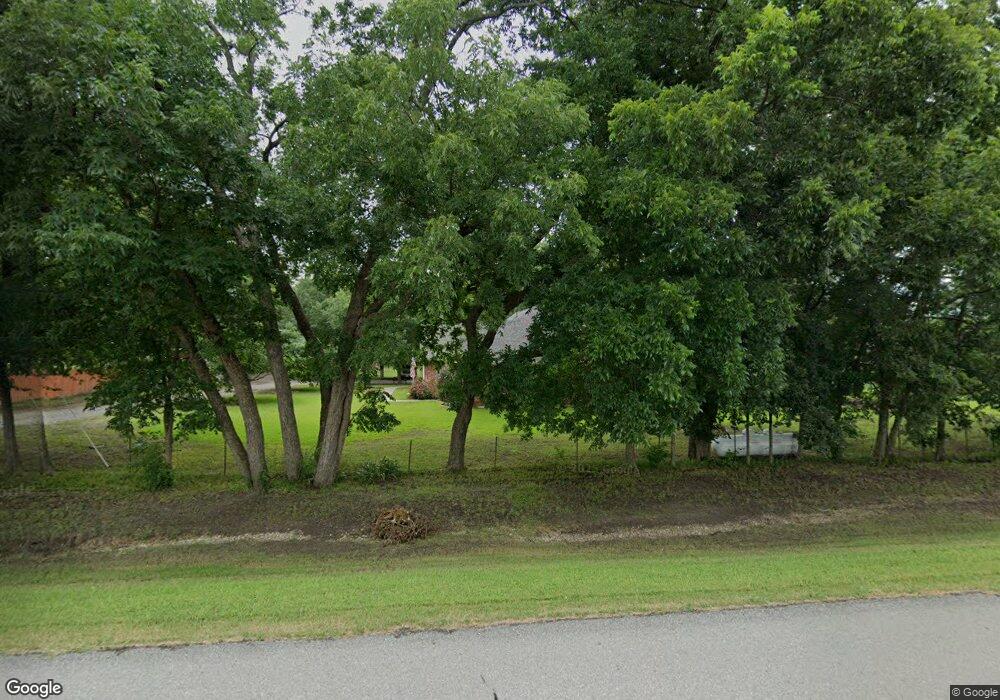
8252 NW State Highway 11 Whitewright, TX 75491
Estimated Value: $350,857 - $518,000
3
Beds
2
Baths
1,695
Sq Ft
$247/Sq Ft
Est. Value
About This Home
This home is located at 8252 NW State Highway 11, Whitewright, TX 75491 and is currently estimated at $419,214, approximately $247 per square foot. 8252 NW State Highway 11 is a home with nearby schools including Finley-Oates Elementary School and LH Rather Jr High School.
Ownership History
Date
Name
Owned For
Owner Type
Purchase Details
Closed on
Aug 7, 2019
Sold by
Jantz Aubry Lynn and Jantz Sharon Kay
Bought by
Jantz Aubry Lynn and Jantz Sharon Kay
Current Estimated Value
Purchase Details
Closed on
May 2, 2016
Sold by
Occhino Kimberly and Occhino John
Bought by
Jantz Aubry L and Jantz Sharon K
Home Financials for this Owner
Home Financials are based on the most recent Mortgage that was taken out on this home.
Original Mortgage
$148,750
Outstanding Balance
$64,370
Interest Rate
3.73%
Mortgage Type
New Conventional
Estimated Equity
$354,844
Purchase Details
Closed on
Mar 26, 2013
Sold by
Cowen Chris and Cowen Shara
Bought by
Occhino Kimberly and Occhino John
Home Financials for this Owner
Home Financials are based on the most recent Mortgage that was taken out on this home.
Original Mortgage
$137,755
Interest Rate
3.59%
Create a Home Valuation Report for This Property
The Home Valuation Report is an in-depth analysis detailing your home's value as well as a comparison with similar homes in the area
Home Values in the Area
Average Home Value in this Area
Purchase History
| Date | Buyer | Sale Price | Title Company |
|---|---|---|---|
| Jantz Aubry Lynn | -- | None Available | |
| Jantz Aubry L | -- | None Available | |
| Occhino Kimberly | -- | None Available |
Source: Public Records
Mortgage History
| Date | Status | Borrower | Loan Amount |
|---|---|---|---|
| Open | Jantz Aubry L | $148,750 | |
| Previous Owner | Occhino Kimberly | $137,755 |
Source: Public Records
Tax History Compared to Growth
Tax History
| Year | Tax Paid | Tax Assessment Tax Assessment Total Assessment is a certain percentage of the fair market value that is determined by local assessors to be the total taxable value of land and additions on the property. | Land | Improvement |
|---|---|---|---|---|
| 2025 | -- | $307,790 | $65,700 | $242,090 |
| 2024 | $4,215 | $347,420 | $80,630 | $266,790 |
| 2023 | $3,893 | $334,460 | $65,800 | $268,660 |
| 2022 | $4,090 | $292,360 | $43,470 | $248,890 |
| 2021 | $4,267 | $229,770 | $22,670 | $207,100 |
| 2020 | $3,938 | $207,160 | $13,130 | $194,030 |
| 2019 | $3,868 | $196,230 | $13,130 | $183,100 |
| 2018 | $3,372 | $171,390 | $9,560 | $161,830 |
| 2017 | $3,027 | $160,530 | $9,560 | $150,970 |
| 2016 | $2,834 | $150,280 | $8,850 | $141,430 |
| 2015 | -- | $143,840 | $8,850 | $134,990 |
| 2014 | -- | $138,520 | $8,850 | $129,670 |
Source: Public Records
Map
Nearby Homes
- 300 County Road 4550
- TBD 124+/- County Road 4550
- TBD 15+/- N S State Highway 121 St
- TBD 37+/- Tract 1 County Road 4526
- TBD 23 +/- Tract 2 County Road 4526
- 308 N Helton St
- 1501 Business Highway 121
- 313 N Main
- 101 E Reed
- 200 E South St
- 470 Fm 896
- 462 County Road 4165
- 473 County Road 4324
- 9778 NW State Highway 11
- 645 County Road 4160
- 2306 County Road 4145
- 2701 Co Rd 4145
- Tbd County Road 4525
- TBD #1 County Road 4145
- TBD Private Road 431
- 8252 Hwy 11
- 8232 Texas 11
- 8232 NW State Highway 11
- 8329 NW State Highway 11
- 8394 NW State Highway 11
- 8207 NW State Highway 11
- 8164 NW State Highway 11
- 8501 NW State Highway 11
- 8687 NW State Highway 11
- TBD County Road 4550
- 640 County Road 4550
- 640 4550
- 7687 NW Hwy 11
- 400 Fm 3297
- 7687 Texas 11
- 564 Fm 3297
- 958 Business Hwy 121
- 1331 Bus Hwy 121
- 505 Fm 3297
- 505 Fm 3297