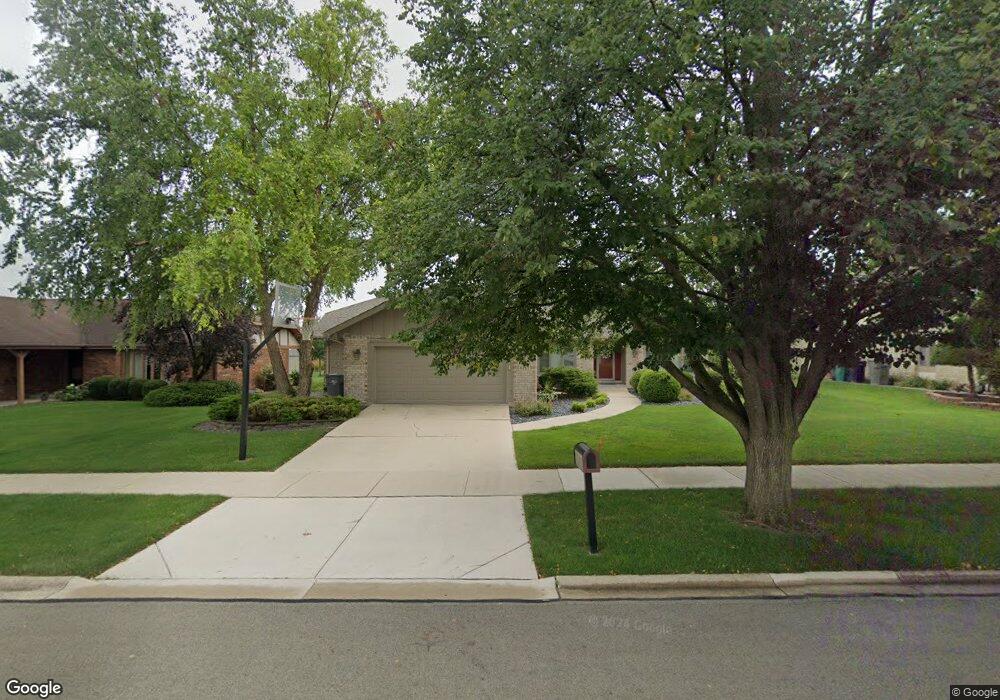
8253 Highgate Ct Orland Park, IL 60462
Silver Lake North NeighborhoodEstimated Value: $430,208 - $568,000
3
Beds
3
Baths
2,007
Sq Ft
$240/Sq Ft
Est. Value
About This Home
This home is located at 8253 Highgate Ct, Orland Park, IL 60462 and is currently estimated at $480,802, approximately $239 per square foot. 8253 Highgate Ct is a home located in Cook County with nearby schools including Prairie Elementary School, Liberty Elementary School, and Jerling Junior High School.
Ownership History
Date
Name
Owned For
Owner Type
Purchase Details
Closed on
Nov 10, 2021
Sold by
Flannery Patrick M and Flannery Claudia V
Bought by
Flannery Patrick and Flannery Cludia
Current Estimated Value
Purchase Details
Closed on
Feb 24, 2017
Sold by
Arrigo Richard V and Arrigo Debra L
Bought by
Flannery Patrick M and Flannery Claudia
Home Financials for this Owner
Home Financials are based on the most recent Mortgage that was taken out on this home.
Original Mortgage
$271,200
Outstanding Balance
$225,392
Interest Rate
4.25%
Mortgage Type
New Conventional
Estimated Equity
$255,410
Purchase Details
Closed on
Aug 29, 2008
Sold by
Palos Bank & Trust Co
Bought by
Arrigo Richard V and Arrigo Debra L
Home Financials for this Owner
Home Financials are based on the most recent Mortgage that was taken out on this home.
Original Mortgage
$268,000
Interest Rate
6.66%
Mortgage Type
Unknown
Purchase Details
Closed on
Feb 16, 1999
Sold by
Miller Stephen J and Miller Bonnie J
Bought by
Palos Bank & Trust Company and Trust #1-4550
Create a Home Valuation Report for This Property
The Home Valuation Report is an in-depth analysis detailing your home's value as well as a comparison with similar homes in the area
Home Values in the Area
Average Home Value in this Area
Purchase History
| Date | Buyer | Sale Price | Title Company |
|---|---|---|---|
| Flannery Patrick | -- | Fidelity National Title | |
| Flannery Patrick M | $339,000 | Baird & Warner Title Service | |
| Arrigo Richard V | $335,000 | Git | |
| Palos Bank & Trust Company | -- | Lawyers Title Insurance Corp |
Source: Public Records
Mortgage History
| Date | Status | Borrower | Loan Amount |
|---|---|---|---|
| Open | Flannery Patrick M | $271,200 | |
| Previous Owner | Arrigo Richard V | $268,000 |
Source: Public Records
Tax History Compared to Growth
Tax History
| Year | Tax Paid | Tax Assessment Tax Assessment Total Assessment is a certain percentage of the fair market value that is determined by local assessors to be the total taxable value of land and additions on the property. | Land | Improvement |
|---|---|---|---|---|
| 2024 | $7,008 | $32,799 | $7,570 | $25,229 |
| 2023 | $5,983 | $33,970 | $7,570 | $26,400 |
| 2022 | $5,983 | $26,129 | $6,561 | $19,568 |
| 2021 | $5,825 | $26,128 | $6,560 | $19,568 |
| 2020 | $7,054 | $30,917 | $6,560 | $24,357 |
| 2019 | $7,631 | $33,973 | $6,055 | $27,918 |
| 2018 | $7,419 | $33,973 | $6,055 | $27,918 |
| 2017 | $7,984 | $33,973 | $6,055 | $27,918 |
| 2016 | $6,698 | $26,503 | $5,551 | $20,952 |
| 2015 | $6,599 | $26,503 | $5,551 | $20,952 |
| 2014 | $6,516 | $26,503 | $5,551 | $20,952 |
| 2013 | $6,920 | $29,630 | $5,551 | $24,079 |
Source: Public Records
Map
Nearby Homes
- 14255 Wedgewood Glens Dr
- 8134 Uxbridge Dr
- 8005 W 143rd Place
- 8608 W 145th St
- 14023 Chelsea Dr
- 14345 S 87th Ave
- 14567 S 82nd Ave
- 8700 Berkley Ct
- 14508 Maycliff Dr
- 14453 S 88th Ave
- 14040 Boxwood Ln
- 8115 Pluskota Dr
- 14712 S 88th Ave
- 14325 Clearview Dr Unit 14325
- 8820 W 140th St Unit 2A
- 14304 Clearview Ct Unit 8904
- 14939 S 81st Ct
- 7991 Forestview Dr
- 14739 Maple Ave
- 13623 S 84th Ave
- 8243 Highgate Ct
- 8255 Highgate Ct
- 8242 Chertsey Ct
- 8250 Chertsey Ct
- 8239 Highgate Ct
- 8257 Highgate Ct
- 8234 Chertsey Ct
- 8258 Chertsey Ct
- 8244 Highgate Ct
- 8236 Highgate Ct
- 8254 Highgate Ct
- 8226 Chertsey Ct
- 8228 Highgate Ct
- 8227 Highgate Ct
- 8262 Highgate Ct
- 8220 Highgate Ct
- 8218 Chertsey Ct
- 8219 Highgate Ct
- 8249 Chertsey Ct
- 8241 Chertsey Ct Unit III