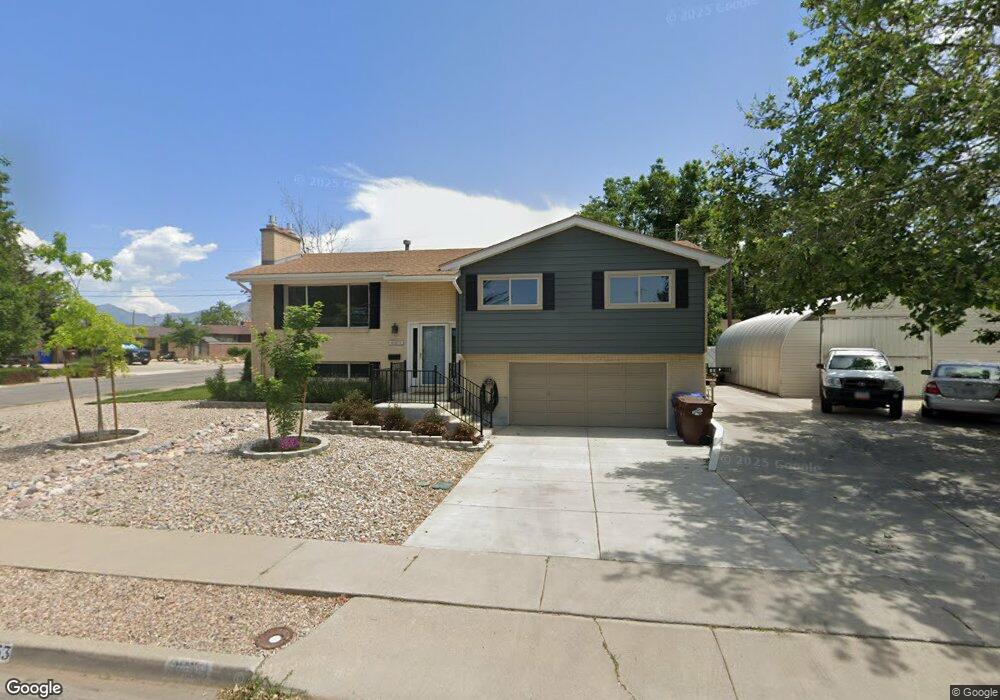
8253 Wood St Midvale, UT 84047
Estimated Value: $507,000 - $573,000
4
Beds
2
Baths
1,344
Sq Ft
$394/Sq Ft
Est. Value
About This Home
This home is located at 8253 Wood St, Midvale, UT 84047 and is currently estimated at $529,801, approximately $394 per square foot. 8253 Wood St is a home located in Salt Lake County with nearby schools including Copperview Elementary School, Midvale Middle School, and Hillcrest High School.
Ownership History
Date
Name
Owned For
Owner Type
Purchase Details
Closed on
May 27, 2016
Sold by
Ivie Shelli L
Bought by
Torgerson Thomas T and Torgerson Shelly M
Current Estimated Value
Home Financials for this Owner
Home Financials are based on the most recent Mortgage that was taken out on this home.
Original Mortgage
$209,600
Outstanding Balance
$166,873
Interest Rate
3.58%
Mortgage Type
New Conventional
Estimated Equity
$362,928
Purchase Details
Closed on
May 21, 2009
Sold by
Ivie Shelli L
Bought by
Ivie Shelli L
Home Financials for this Owner
Home Financials are based on the most recent Mortgage that was taken out on this home.
Original Mortgage
$148,000
Interest Rate
4.8%
Mortgage Type
New Conventional
Purchase Details
Closed on
Aug 18, 2004
Sold by
Ivie Joel R
Bought by
Ivie Shelli L
Home Financials for this Owner
Home Financials are based on the most recent Mortgage that was taken out on this home.
Original Mortgage
$127,500
Interest Rate
5%
Mortgage Type
New Conventional
Create a Home Valuation Report for This Property
The Home Valuation Report is an in-depth analysis detailing your home's value as well as a comparison with similar homes in the area
Home Values in the Area
Average Home Value in this Area
Purchase History
| Date | Buyer | Sale Price | Title Company |
|---|---|---|---|
| Torgerson Thomas T | -- | Metro National Title | |
| Ivie Shelli L | -- | Metro National Title | |
| Ivie Shelli L | -- | Founders Title |
Source: Public Records
Mortgage History
| Date | Status | Borrower | Loan Amount |
|---|---|---|---|
| Open | Torgerson Thomas T | $209,600 | |
| Previous Owner | Ivie Shelli L | $148,000 | |
| Previous Owner | Ivie Shelli L | $127,500 |
Source: Public Records
Tax History Compared to Growth
Tax History
| Year | Tax Paid | Tax Assessment Tax Assessment Total Assessment is a certain percentage of the fair market value that is determined by local assessors to be the total taxable value of land and additions on the property. | Land | Improvement |
|---|---|---|---|---|
| 2025 | $2,499 | $453,400 | $135,400 | $318,000 |
| 2024 | $2,499 | $426,200 | $128,200 | $298,000 |
| 2023 | $2,444 | $413,900 | $121,800 | $292,100 |
| 2022 | $2,642 | $437,000 | $119,400 | $317,600 |
| 2021 | $2,434 | $345,500 | $109,500 | $236,000 |
| 2020 | $2,079 | $279,500 | $79,600 | $199,900 |
| 2019 | $1,969 | $258,500 | $74,600 | $183,900 |
| 2018 | $1,891 | $251,900 | $74,600 | $177,300 |
| 2017 | $1,806 | $231,900 | $74,600 | $157,300 |
| 2016 | $1,790 | $223,200 | $74,600 | $148,600 |
| 2015 | $1,536 | $188,800 | $74,600 | $114,200 |
| 2014 | $1,463 | $175,800 | $70,100 | $105,700 |
Source: Public Records
Map
Nearby Homes
- 8269 S Roosevelt St
- 8331 S Monroe St
- 59 W Princeton Dr
- 71 W Princeton Dr
- 27 W Princeton Dr
- 139 W Columbia Dr
- 74 E Resaca Dr Unit B12
- 8279 S Jackson St
- 8033 S Monroe St
- 116 E Resaca Dr Unit F9
- 8296 Jackson St
- 8264 S Resaca Dr Unit K9
- 7994 Roosevelt St
- 132 E Chambord Ct
- 257 Cornell Dr
- 140 E Chambord Ct
- 139 E Abbeville Ct
- 144 E Chambord Ct
- 56 Apollo Way
- 135 E Station St
- 8253 S Wood St
- 47 W La Salle Dr
- 47 La Salle Dr
- 8259 Wood St Unit 8263
- 8252 Wood St
- 37 W La Salle Dr
- 37 La Salle Dr
- 42 Marquette Dr
- 8221 S Wood St
- 8221 Wood St
- 42 W Marquette Dr
- 8244 Wood St
- 46 La Salle Dr
- 69 Marquette Dr
- 46 W La Salle Dr Unit 60
- 46 W La Salle Dr
- 8226 Wilson St
- 8224 S Wood St
- 8224 Wood St
- 8264 Wood St