8254 W 300 N Andrews, IN 46702
--
Bed
--
Bath
13,885
Sq Ft
3.03
Acres
About This Home
This home is located at 8254 W 300 N, Andrews, IN 46702. 8254 W 300 N is a home located in Huntington County with nearby schools including Andrews Elementary School, Riverview Middle School, and Huntington North High School.
Ownership History
Date
Name
Owned For
Owner Type
Purchase Details
Closed on
Aug 23, 2017
Sold by
Pefley Properties Llc
Bought by
Lori Properties Llc
Home Financials for this Owner
Home Financials are based on the most recent Mortgage that was taken out on this home.
Original Mortgage
$224,000
Outstanding Balance
$119,634
Interest Rate
3.92%
Mortgage Type
Future Advance Clause Open End Mortgage
Purchase Details
Closed on
Apr 25, 2016
Sold by
Drp Company Inc
Bought by
Pefley Properties Llc
Purchase Details
Closed on
Oct 26, 2011
Sold by
Drp Investments Llc
Bought by
Drp Company Inc
Purchase Details
Closed on
Jul 15, 2011
Sold by
Not Provided
Bought by
Inve Drp
Purchase Details
Closed on
Jul 19, 2007
Sold by
Huntington Ready Mix Inc
Bought by
Gibson Tami and Hull John David
Purchase Details
Closed on
May 12, 2006
Sold by
Huntington Ready Mix Inc
Bought by
Knecht Exavating Inc
Create a Home Valuation Report for This Property
The Home Valuation Report is an in-depth analysis detailing your home's value as well as a comparison with similar homes in the area
Home Values in the Area
Average Home Value in this Area
Purchase History
| Date | Buyer | Sale Price | Title Company |
|---|---|---|---|
| Lori Properties Llc | -- | None Available | |
| Pefley Properties Llc | -- | None Available | |
| Drp Company Inc | $172,000 | Midwest Title & Escrow Llc | |
| Inve Drp | $215,000 | Lime City Title Services Llc | |
| Gibson Tami | -- | Lawyers Title | |
| Knecht Exavating Inc | -- | None Available |
Source: Public Records
Mortgage History
| Date | Status | Borrower | Loan Amount |
|---|---|---|---|
| Open | Lori Properties Llc | $224,000 |
Source: Public Records
Tax History Compared to Growth
Tax History
| Year | Tax Paid | Tax Assessment Tax Assessment Total Assessment is a certain percentage of the fair market value that is determined by local assessors to be the total taxable value of land and additions on the property. | Land | Improvement |
|---|---|---|---|---|
| 2024 | $6,161 | $391,100 | $39,700 | $351,400 |
| 2023 | $6,521 | $391,100 | $39,700 | $351,400 |
| 2022 | $5,825 | $359,800 | $39,700 | $320,100 |
| 2021 | $5,554 | $311,300 | $39,700 | $271,600 |
| 2020 | $4,654 | $251,600 | $39,700 | $211,900 |
| 2019 | $2,443 | $144,200 | $39,700 | $104,500 |
| 2018 | $2,435 | $137,000 | $39,700 | $97,300 |
| 2017 | $2,181 | $136,000 | $39,700 | $96,300 |
| 2016 | $2,121 | $134,900 | $39,700 | $95,200 |
| 2014 | $2,405 | $148,200 | $39,700 | $108,500 |
| 2013 | $2,405 | $150,200 | $39,700 | $110,500 |
Source: Public Records
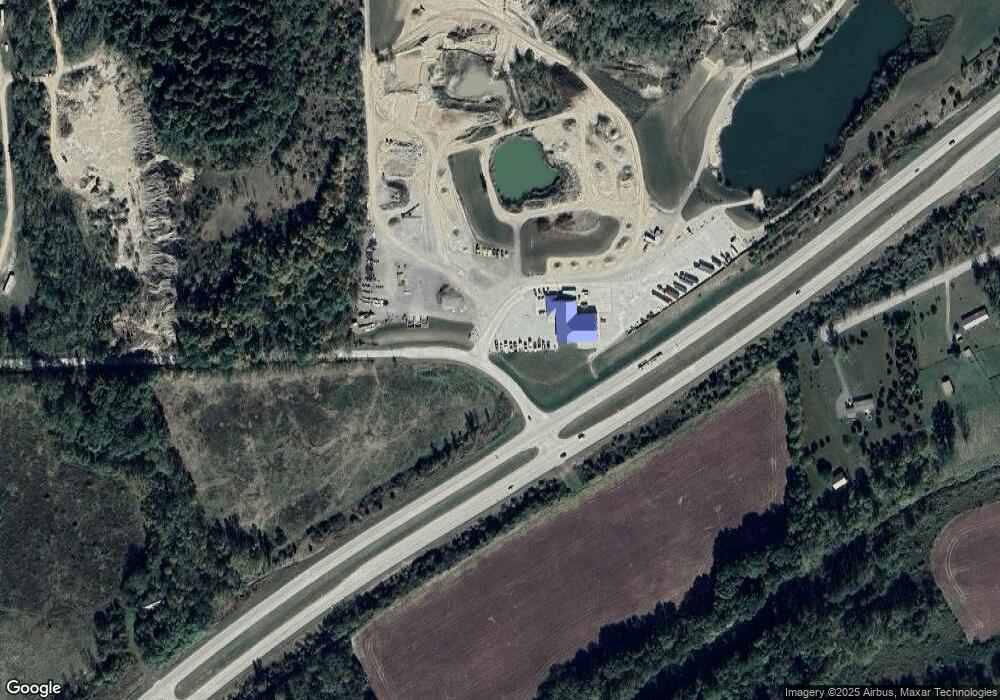
Map
Nearby Homes
- 874 N Jackson St
- 330 W Mckeever St
- 187 S Snowden St
- 63 E Mckeever St
- 2848 N 800 E
- TBD W Maple Grove Rd
- 5562 W 100 N
- 5725 W 600 N
- 1920 Hunters Ridge Dr
- TBD 495 N
- 58 Quayle Run
- 2217 Miami Trail
- 2207 Miami Trail
- 2200 Miami Trail
- 2210 Miami Trail
- 1513 Avon Place
- 1239 Lucas Ct
- 1106 Elias Murray Dr
- 92 S 425 W
- 2063 Archangel