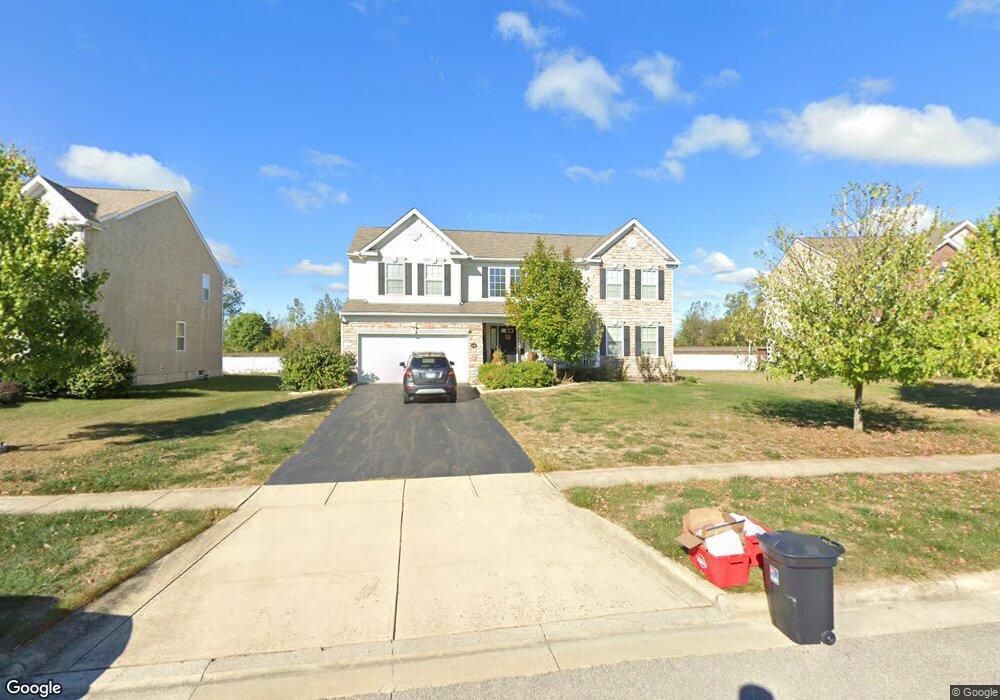
8257 Orange Station Loop Unit 6652 Lewis Center, OH 43035
Orange NeighborhoodEstimated Value: $473,000 - $536,000
4
Beds
3
Baths
2,802
Sq Ft
$178/Sq Ft
Est. Value
About This Home
This home is located at 8257 Orange Station Loop Unit 6652, Lewis Center, OH 43035 and is currently estimated at $499,311, approximately $178 per square foot. 8257 Orange Station Loop Unit 6652 is a home located in Delaware County with nearby schools including Glen Oak Elementary School, Olentangy Orange Middle School, and Orange High School.
Ownership History
Date
Name
Owned For
Owner Type
Purchase Details
Closed on
Sep 18, 2018
Sold by
Chavana Pete L and Chavana Eun Y
Bought by
Chavana Pete L and Chavana Eun Y
Current Estimated Value
Home Financials for this Owner
Home Financials are based on the most recent Mortgage that was taken out on this home.
Original Mortgage
$244,744
Outstanding Balance
$208,016
Interest Rate
4.37%
Mortgage Type
FHA
Estimated Equity
$291,295
Purchase Details
Closed on
Apr 29, 2009
Sold by
Maronda Homes Inc Of Ohio
Bought by
Chavana Pete L and Chavana Eun Y
Home Financials for this Owner
Home Financials are based on the most recent Mortgage that was taken out on this home.
Original Mortgage
$211,105
Interest Rate
4.85%
Mortgage Type
FHA
Create a Home Valuation Report for This Property
The Home Valuation Report is an in-depth analysis detailing your home's value as well as a comparison with similar homes in the area
Home Values in the Area
Average Home Value in this Area
Purchase History
| Date | Buyer | Sale Price | Title Company |
|---|---|---|---|
| Chavana Pete L | -- | None Available | |
| Chavana Pete L | $215,000 | Stewart Title Oh |
Source: Public Records
Mortgage History
| Date | Status | Borrower | Loan Amount |
|---|---|---|---|
| Open | Chavana Pete L | $244,744 | |
| Closed | Chavana Pete L | $211,105 |
Source: Public Records
Tax History Compared to Growth
Tax History
| Year | Tax Paid | Tax Assessment Tax Assessment Total Assessment is a certain percentage of the fair market value that is determined by local assessors to be the total taxable value of land and additions on the property. | Land | Improvement |
|---|---|---|---|---|
| 2024 | $7,541 | $136,220 | $24,920 | $111,300 |
| 2023 | $7,569 | $136,220 | $24,920 | $111,300 |
| 2022 | $6,541 | $95,690 | $17,780 | $77,910 |
| 2021 | $6,578 | $95,690 | $17,780 | $77,910 |
| 2020 | $6,609 | $95,690 | $17,780 | $77,910 |
| 2019 | $5,027 | $75,360 | $14,000 | $61,360 |
| 2018 | $5,050 | $75,360 | $14,000 | $61,360 |
| 2017 | $4,992 | $72,800 | $10,850 | $61,950 |
| 2016 | $5,189 | $72,800 | $10,850 | $61,950 |
| 2015 | $4,737 | $72,800 | $10,850 | $61,950 |
| 2014 | $4,804 | $72,800 | $10,850 | $61,950 |
| 2013 | $4,679 | $69,300 | $10,850 | $58,450 |
Source: Public Records
Map
Nearby Homes
- 789 Hidden Springs Dr
- 810 Mystic Pointe Dr
- 7742 Holderman St
- 1326 Westwood Dr
- 1719 Impatiens Way
- 8268 Coppertop Ln
- 7633 Storrington Place
- 1811 Ivy St
- 1654 Sunflower St
- 0 E Orange Rd Unit lot 1
- 0 E Orange Rd
- 1955 Royal Oak Dr
- 1143 Little Bear Place
- 1915 Myrtle St
- 1923 Myrtle St
- 2347 Jaxton Ct
- 6964 Saint Ninians St
- 2165 Ben Brush Place
- 0 N Parkway Dr Unit 225026764
- 275 N Parkway Dr
- 8257 Orange Station Loop
- 8241 Orange Station Loop
- 8271 Orange Station Loop
- 8227 Orange Station Loop
- 8227 Orange Station Loop Unit 6654
- 8283 Orange Station Loop
- 8254 Orange Station Loop
- 8278 Orange Station Loop
- 8211 Orange Station Loop
- 8238 Orange Station Loop
- 8238 Orange Station Loop Unit 6683
- 8295 Orange Station Loop
- 8224 Orange Station Loop
- 8306 Orange Station Loop
- 8195 Orange Station Loop
- 8206 Orange Station Loop
- 8309 Orange Station Loop
- 8338 Orange Station Loop
- 8179 Orange Station Loop
- 8179 Orange Station Loop Unit 6657