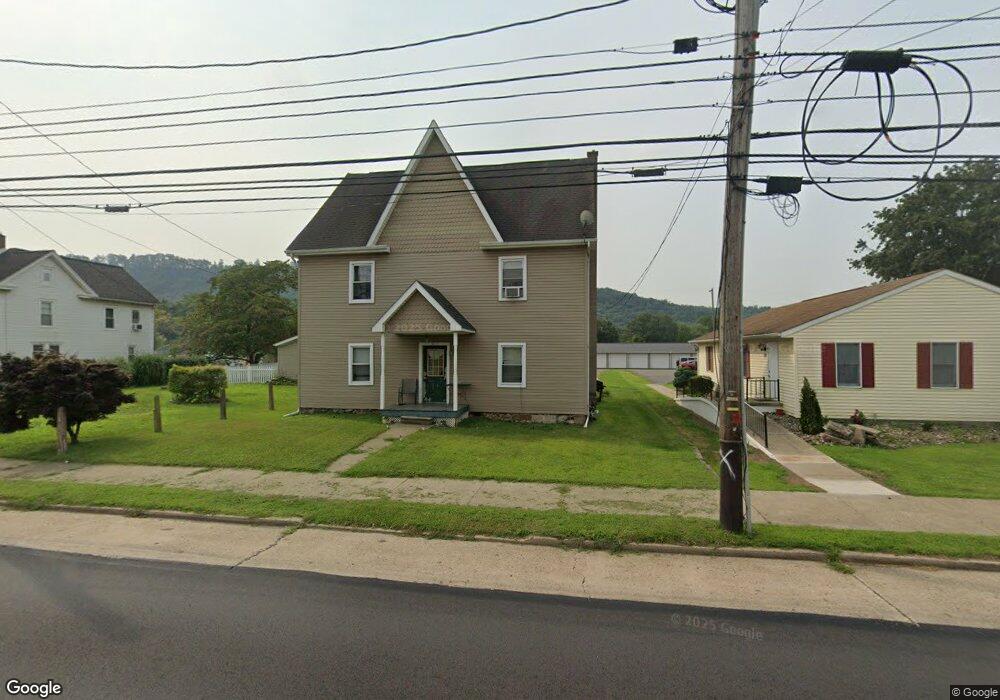
826 3rd St Nescopeck, PA 18635
Estimated Value: $189,693 - $282,000
Studio
--
Bath
2,170
Sq Ft
$111/Sq Ft
Est. Value
About This Home
This home is located at 826 3rd St, Nescopeck, PA 18635 and is currently estimated at $240,423, approximately $110 per square foot. 826 3rd St is a home located in Luzerne County with nearby schools including Berwick Area High School, Holy Family Consolidated School, and New Story School.
Ownership History
Date
Name
Owned For
Owner Type
Purchase Details
Closed on
Sep 6, 2017
Sold by
Hopper Robert F and Rescorla Sally
Bought by
Shoemaker Jared K
Current Estimated Value
Home Financials for this Owner
Home Financials are based on the most recent Mortgage that was taken out on this home.
Original Mortgage
$88,000
Outstanding Balance
$72,640
Interest Rate
3.92%
Mortgage Type
Future Advance Clause Open End Mortgage
Estimated Equity
$167,783
Purchase Details
Closed on
Mar 13, 2001
Bought by
Hopper Robert F
Create a Home Valuation Report for This Property
The Home Valuation Report is an in-depth analysis detailing your home's value as well as a comparison with similar homes in the area
Home Values in the Area
Average Home Value in this Area
Purchase History
| Date | Buyer | Sale Price | Title Company |
|---|---|---|---|
| Shoemaker Jared K | $78,000 | None Available | |
| Hopper Robert F | $28,000 | -- |
Source: Public Records
Mortgage History
| Date | Status | Borrower | Loan Amount |
|---|---|---|---|
| Open | Shoemaker Jared K | $88,000 |
Source: Public Records
Tax History
| Year | Tax Paid | Tax Assessment Tax Assessment Total Assessment is a certain percentage of the fair market value that is determined by local assessors to be the total taxable value of land and additions on the property. | Land | Improvement |
|---|---|---|---|---|
| 2026 | $2,075 | $91,100 | $20,400 | $70,700 |
| 2025 | $2,047 | $91,100 | $20,400 | $70,700 |
| 2024 | $1,985 | $91,100 | $20,400 | $70,700 |
| 2023 | $1,906 | $91,100 | $20,400 | $70,700 |
| 2022 | $1,889 | $91,100 | $20,400 | $70,700 |
| 2021 | $1,744 | $91,100 | $20,400 | $70,700 |
| 2020 | $1,691 | $91,100 | $20,400 | $70,700 |
| 2019 | $1,679 | $91,100 | $20,400 | $70,700 |
| 2018 | $1,667 | $91,100 | $20,400 | $70,700 |
| 2017 | $1,732 | $91,100 | $20,400 | $70,700 |
| 2016 | -- | $91,100 | $20,400 | $70,700 |
| 2015 | -- | $91,100 | $20,400 | $70,700 |
| 2014 | -- | $91,100 | $20,400 | $70,700 |
Source: Public Records
Map
Nearby Homes
Your Personal Tour Guide
Ask me questions while you tour the home.