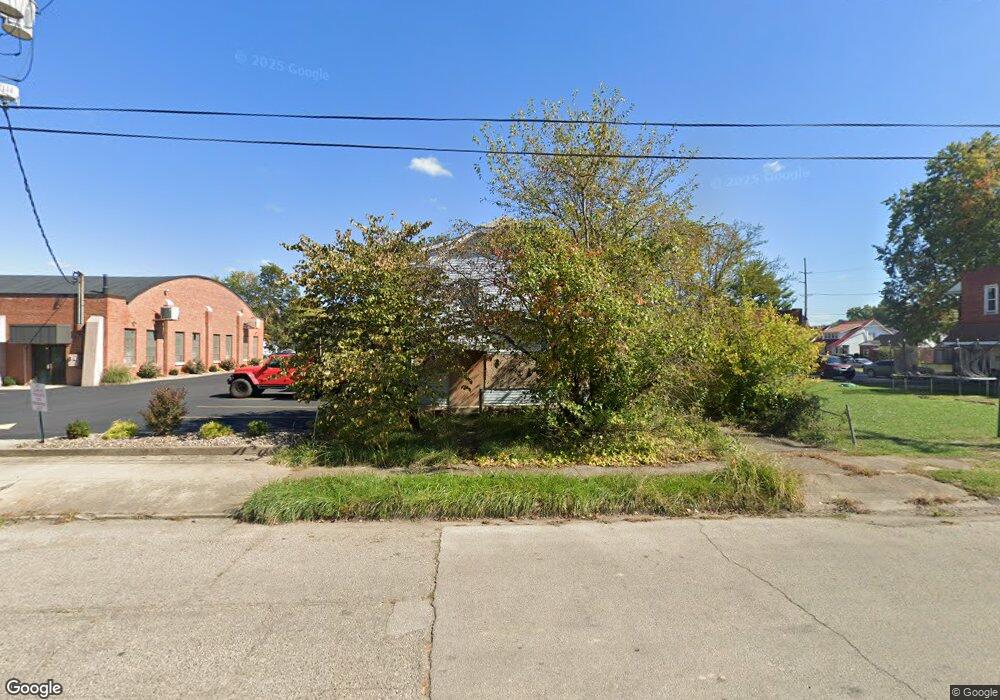
826 5th St W Huntington, WV 25701
Southside NeighborhoodEstimated Value: $94,000 - $131,000
3
Beds
2
Baths
1,888
Sq Ft
$59/Sq Ft
Est. Value
About This Home
This home is located at 826 5th St W, Huntington, WV 25701 and is currently estimated at $111,597, approximately $59 per square foot. 826 5th St W is a home located in Cabell County with nearby schools including Southside Elementary School, Huntington Middle School, and Huntington High School.
Ownership History
Date
Name
Owned For
Owner Type
Purchase Details
Closed on
Mar 24, 2025
Sold by
Tfb Pro Llc
Bought by
Th Properties & Management Llc
Current Estimated Value
Purchase Details
Closed on
Jun 11, 2020
Sold by
Mvb Bank Inc
Bought by
Tfb Rpo Llc
Purchase Details
Closed on
May 2, 2018
Sold by
Fulton Gary R
Bought by
First State Bank
Purchase Details
Closed on
Nov 12, 2009
Sold by
Davis Robert Donaldson and Davis Bruce Paul
Bought by
Fulton Gary R
Create a Home Valuation Report for This Property
The Home Valuation Report is an in-depth analysis detailing your home's value as well as a comparison with similar homes in the area
Home Values in the Area
Average Home Value in this Area
Purchase History
| Date | Buyer | Sale Price | Title Company |
|---|---|---|---|
| Th Properties & Management Llc | -- | None Listed On Document | |
| Th Properties & Management Llc | -- | None Listed On Document | |
| Tfb Rpo Llc | $33,000 | None Available | |
| First State Bank | $75,993 | None Available | |
| Fulton Gary R | -- | -- |
Source: Public Records
Tax History Compared to Growth
Tax History
| Year | Tax Paid | Tax Assessment Tax Assessment Total Assessment is a certain percentage of the fair market value that is determined by local assessors to be the total taxable value of land and additions on the property. | Land | Improvement |
|---|---|---|---|---|
| 2024 | $1,288 | $49,800 | $9,300 | $40,500 |
| 2023 | $1,683 | $49,800 | $9,300 | $40,500 |
| 2022 | $1,571 | $46,140 | $9,300 | $36,840 |
| 2021 | $1,173 | $34,260 | $4,920 | $29,340 |
| 2020 | $1,132 | $34,260 | $4,920 | $29,340 |
| 2019 | $1,159 | $34,260 | $4,920 | $29,340 |
| 2018 | $1,161 | $34,260 | $4,920 | $29,340 |
| 2017 | $1,145 | $33,780 | $4,920 | $28,860 |
| 2016 | $1,219 | $36,000 | $4,920 | $31,080 |
| 2015 | $1,217 | $36,000 | $4,920 | $31,080 |
| 2014 | $1,218 | $36,000 | $4,920 | $31,080 |
Source: Public Records
Map
Nearby Homes