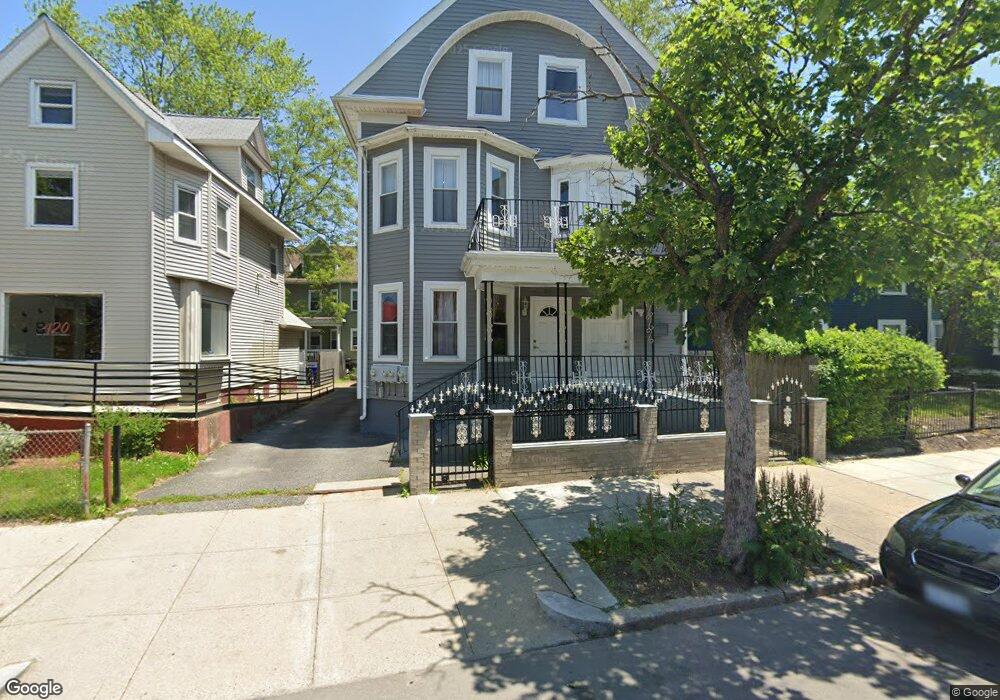
826 Broad St Providence, RI 02907
Lower South Providence NeighborhoodEstimated Value: $565,000 - $1,141,965
7
Beds
2
Baths
2,390
Sq Ft
$300/Sq Ft
Est. Value
About This Home
This home is located at 826 Broad St, Providence, RI 02907 and is currently estimated at $717,991, approximately $300 per square foot. 826 Broad St is a home located in Providence County with nearby schools including Highlander Charter School, Paul Cuffee High School, and Bishop Mcvinney Elementary School.
Ownership History
Date
Name
Owned For
Owner Type
Purchase Details
Closed on
Jun 23, 2003
Sold by
Remy Eddy
Bought by
Duran Martin
Current Estimated Value
Home Financials for this Owner
Home Financials are based on the most recent Mortgage that was taken out on this home.
Original Mortgage
$142,500
Outstanding Balance
$61,572
Interest Rate
5.71%
Mortgage Type
Purchase Money Mortgage
Estimated Equity
$656,419
Create a Home Valuation Report for This Property
The Home Valuation Report is an in-depth analysis detailing your home's value as well as a comparison with similar homes in the area
Home Values in the Area
Average Home Value in this Area
Purchase History
| Date | Buyer | Sale Price | Title Company |
|---|---|---|---|
| Duran Martin | $150,000 | -- |
Source: Public Records
Mortgage History
| Date | Status | Borrower | Loan Amount |
|---|---|---|---|
| Open | Duran Martin | $142,500 |
Source: Public Records
Tax History
| Year | Tax Paid | Tax Assessment Tax Assessment Total Assessment is a certain percentage of the fair market value that is determined by local assessors to be the total taxable value of land and additions on the property. | Land | Improvement |
|---|---|---|---|---|
| 2025 | $3,742 | $495,600 | $118,500 | $377,100 |
| 2024 | $6,133 | $334,200 | $67,600 | $266,600 |
| 2023 | $6,133 | $334,200 | $67,600 | $266,600 |
| 2022 | $5,949 | $334,200 | $67,600 | $266,600 |
| 2021 | $4,590 | $186,900 | $29,800 | $157,100 |
| 2020 | $4,590 | $186,900 | $29,800 | $157,100 |
| 2019 | $4,590 | $186,900 | $29,800 | $157,100 |
| 2018 | $4,132 | $129,300 | $27,100 | $102,200 |
| 2017 | $4,132 | $129,300 | $27,100 | $102,200 |
| 2016 | $4,132 | $129,300 | $27,100 | $102,200 |
| 2015 | $3,691 | $111,500 | $27,100 | $84,400 |
| 2014 | $3,763 | $111,500 | $27,100 | $84,400 |
| 2013 | $3,763 | $111,500 | $27,100 | $84,400 |
Source: Public Records
Map
Nearby Homes
- 38 Mitchell St
- 296 Potters Ave
- 136 Houston St
- 8 Atlantic Ave
- 171 Reynolds Ave
- 33 Adelaide Ave
- 61 Stanwood St
- 131 Mitchell St
- 462 Prairie Ave
- 75 Sumter St
- 664 Public St
- 110 Gallup St
- 218 Hamilton St
- 99 Colfax St
- 14 Burnside St
- 3 Mount Vernon St
- 24 Reynolds Ave
- 183 Congress Ave
- 182 Adelaide Ave Unit 2
- 186 Oxford St
Your Personal Tour Guide
Ask me questions while you tour the home.