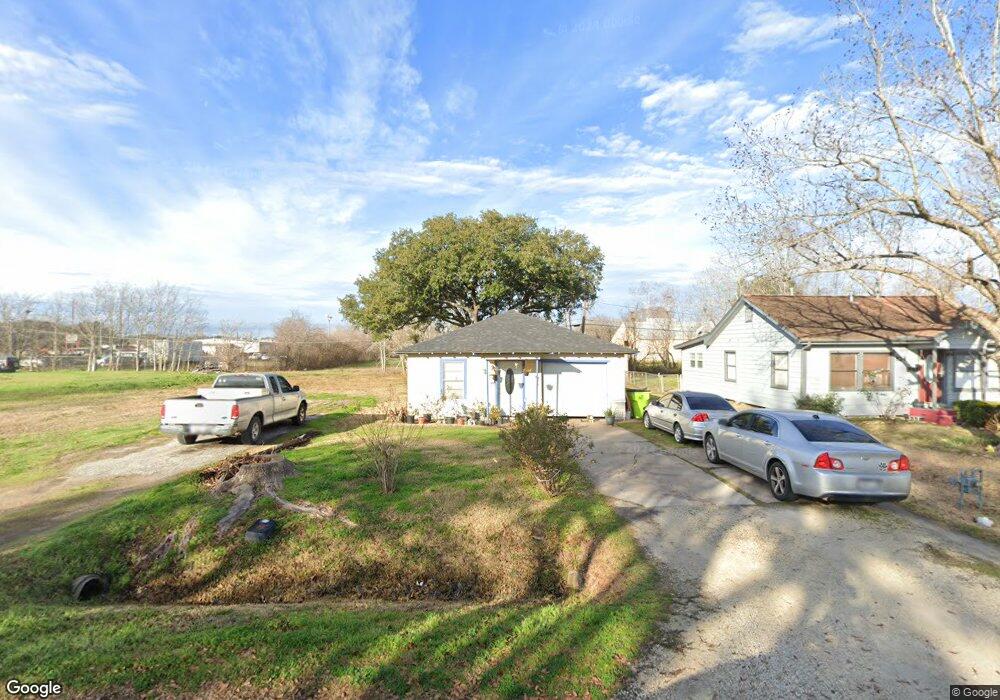
826 Damon St Rosenberg, TX 77471
Estimated Value: $128,290 - $179,000
2
Beds
1
Bath
768
Sq Ft
$190/Sq Ft
Est. Value
About This Home
This home is located at 826 Damon St, Rosenberg, TX 77471 and is currently estimated at $146,097, approximately $190 per square foot. 826 Damon St is a home located in Fort Bend County with nearby schools including Travis Elementary School, Navarro Middle School, and George Junior High School.
Ownership History
Date
Name
Owned For
Owner Type
Purchase Details
Closed on
Jul 19, 2006
Sold by
Acosta Juan
Bought by
Gutierrez Juan Antonio and Gutierrez Gloria I
Current Estimated Value
Purchase Details
Closed on
Feb 25, 1999
Sold by
Ricklefsen Clara
Bought by
Acosta Juan
Home Financials for this Owner
Home Financials are based on the most recent Mortgage that was taken out on this home.
Original Mortgage
$14,750
Interest Rate
6.74%
Mortgage Type
Seller Take Back
Create a Home Valuation Report for This Property
The Home Valuation Report is an in-depth analysis detailing your home's value as well as a comparison with similar homes in the area
Home Values in the Area
Average Home Value in this Area
Purchase History
| Date | Buyer | Sale Price | Title Company |
|---|---|---|---|
| Gutierrez Juan Antonio | -- | None Available | |
| Gutierrez Juan Antonio | -- | -- | |
| Acosta Juan | -- | -- |
Source: Public Records
Mortgage History
| Date | Status | Borrower | Loan Amount |
|---|---|---|---|
| Previous Owner | Acosta Juan | $14,750 |
Source: Public Records
Tax History Compared to Growth
Tax History
| Year | Tax Paid | Tax Assessment Tax Assessment Total Assessment is a certain percentage of the fair market value that is determined by local assessors to be the total taxable value of land and additions on the property. | Land | Improvement |
|---|---|---|---|---|
| 2025 | $526 | $70,000 | $30,845 | $39,155 |
| 2024 | $526 | $88,645 | $16,926 | $71,719 |
| 2023 | $504 | $80,586 | $8,341 | $72,245 |
| 2022 | $886 | $73,260 | $14,450 | $58,810 |
| 2021 | $1,382 | $66,600 | $18,510 | $48,090 |
| 2020 | $1,419 | $66,870 | $18,510 | $48,360 |
| 2019 | $1,526 | $66,800 | $18,510 | $48,290 |
| 2018 | $1,485 | $63,970 | $18,510 | $45,460 |
| 2017 | $1,458 | $62,480 | $18,510 | $43,970 |
| 2016 | $1,447 | $62,000 | $18,510 | $43,490 |
| 2015 | $1,044 | $62,930 | $18,510 | $44,420 |
| 2014 | $1,109 | $58,970 | $18,510 | $40,460 |
Source: Public Records
Map
Nearby Homes