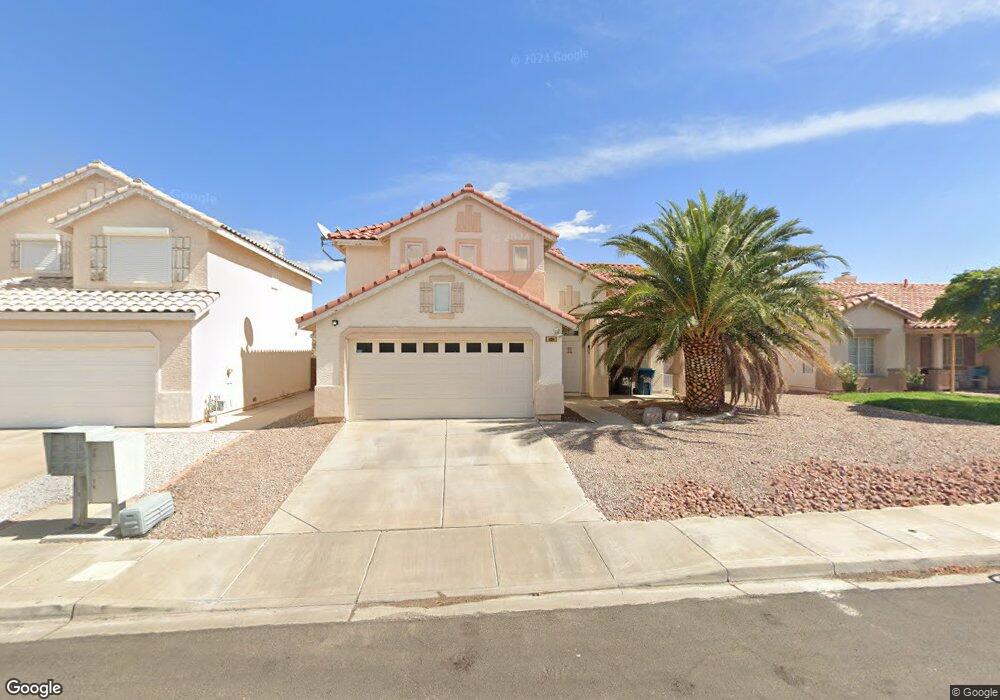
826 Grape Vine Ave Henderson, NV 89002
Highland Hills NeighborhoodEstimated Value: $471,000 - $519,000
4
Beds
3
Baths
1,909
Sq Ft
$262/Sq Ft
Est. Value
About This Home
This home is located at 826 Grape Vine Ave, Henderson, NV 89002 and is currently estimated at $500,045, approximately $261 per square foot. 826 Grape Vine Ave is a home located in Clark County with nearby schools including Fay Galloway Elementary School, Jack & Terry Mannion Middle School, and Foothill High School.
Ownership History
Date
Name
Owned For
Owner Type
Purchase Details
Closed on
Jul 5, 2016
Sold by
Ricciardo Adam
Bought by
Esseltine Tenna M and Esseltine Craig A
Current Estimated Value
Home Financials for this Owner
Home Financials are based on the most recent Mortgage that was taken out on this home.
Original Mortgage
$255,290
Outstanding Balance
$203,271
Interest Rate
3.5%
Mortgage Type
FHA
Estimated Equity
$296,774
Purchase Details
Closed on
Apr 4, 2011
Sold by
Secretary Of Housing & Urban Development
Bought by
Ricciardo Adam
Home Financials for this Owner
Home Financials are based on the most recent Mortgage that was taken out on this home.
Original Mortgage
$121,831
Interest Rate
4.87%
Mortgage Type
FHA
Purchase Details
Closed on
May 14, 2010
Sold by
Chase Home Finance Llc
Bought by
Secretary Of The Department Of Housing &
Purchase Details
Closed on
Apr 21, 2010
Sold by
Rushworth James M
Bought by
Chase Home Finance Llc
Purchase Details
Closed on
Mar 11, 2008
Sold by
Ferguson Brian and Ruehl Susan
Bought by
Rushworth James M
Home Financials for this Owner
Home Financials are based on the most recent Mortgage that was taken out on this home.
Original Mortgage
$295,821
Interest Rate
5.65%
Mortgage Type
FHA
Purchase Details
Closed on
Mar 5, 2008
Sold by
Rushworth Elizabeth
Bought by
Rushworth James M
Home Financials for this Owner
Home Financials are based on the most recent Mortgage that was taken out on this home.
Original Mortgage
$295,821
Interest Rate
5.65%
Mortgage Type
FHA
Purchase Details
Closed on
Jul 19, 2005
Sold by
Heers James J
Bought by
Ferguson Brian and Ruehl Susan
Home Financials for this Owner
Home Financials are based on the most recent Mortgage that was taken out on this home.
Original Mortgage
$240,000
Interest Rate
5.51%
Mortgage Type
Fannie Mae Freddie Mac
Purchase Details
Closed on
Mar 17, 2004
Sold by
Beers Cindy
Bought by
Beers James J
Home Financials for this Owner
Home Financials are based on the most recent Mortgage that was taken out on this home.
Original Mortgage
$200,000
Interest Rate
6.25%
Mortgage Type
Unknown
Purchase Details
Closed on
Dec 14, 1995
Sold by
Meridian Homes Inc
Bought by
Jones Kevin Lyn and Jones Robin A
Home Financials for this Owner
Home Financials are based on the most recent Mortgage that was taken out on this home.
Original Mortgage
$130,549
Interest Rate
7.47%
Mortgage Type
Assumption
Create a Home Valuation Report for This Property
The Home Valuation Report is an in-depth analysis detailing your home's value as well as a comparison with similar homes in the area
Home Values in the Area
Average Home Value in this Area
Purchase History
| Date | Buyer | Sale Price | Title Company |
|---|---|---|---|
| Esseltine Tenna M | $260,000 | Ticor Title Las Vegas | |
| Ricciardo Adam | $129,000 | Nevada Title Las Vegas | |
| Secretary Of The Department Of Housing & | -- | None Available | |
| Chase Home Finance Llc | $324,589 | Accommodation | |
| Rushworth James M | $305,000 | Nevada State Title | |
| Rushworth James M | -- | Nevada State Title | |
| Rushworth James M | -- | Accommodation | |
| Ferguson Brian | $360,000 | Old Republic Title Co Of Nv | |
| Beers James J | -- | Old Republic Title Co Of Ne | |
| Beers James J | $250,000 | Old Republic Title Co Of Ne | |
| Jones Kevin Lyn | $128,000 | First American Title Co |
Source: Public Records
Mortgage History
| Date | Status | Borrower | Loan Amount |
|---|---|---|---|
| Open | Esseltine Tenna M | $255,290 | |
| Previous Owner | Ricciardo Adam | $121,831 | |
| Previous Owner | Rushworth James M | $295,821 | |
| Previous Owner | Ferguson Brian | $240,000 | |
| Previous Owner | Beers James J | $200,000 | |
| Previous Owner | Jones Kevin Lyn | $130,549 | |
| Closed | Beers James J | $25,000 |
Source: Public Records
Tax History Compared to Growth
Tax History
| Year | Tax Paid | Tax Assessment Tax Assessment Total Assessment is a certain percentage of the fair market value that is determined by local assessors to be the total taxable value of land and additions on the property. | Land | Improvement |
|---|---|---|---|---|
| 2025 | $2,251 | $99,640 | $26,950 | $72,690 |
| 2024 | $2,085 | $99,640 | $26,950 | $72,690 |
| 2023 | $2,085 | $101,199 | $32,200 | $68,999 |
| 2022 | $1,930 | $90,690 | $27,300 | $63,390 |
| 2021 | $1,788 | $84,589 | $24,150 | $60,439 |
| 2020 | $1,657 | $83,829 | $23,800 | $60,029 |
| 2019 | $1,553 | $80,203 | $21,000 | $59,203 |
| 2018 | $1,482 | $74,108 | $17,150 | $56,958 |
| 2017 | $2,135 | $73,658 | $15,750 | $57,908 |
| 2016 | $1,388 | $66,044 | $8,050 | $57,994 |
| 2015 | $1,385 | $52,761 | $8,050 | $44,711 |
| 2014 | $1,341 | $44,925 | $7,350 | $37,575 |
Source: Public Records
Map
Nearby Homes
- Plan 2124 at Caspian Bay - Landings
- Plan 2069 Modeled at Caspian Bay - Landings
- Plan 1850 Modeled at Caspian Bay - Landings
- Plan 1572 at Caspian Bay - Landings
- Plan 2469 Modeled at Caspian Bay - Landings
- 850 Grape Vine Ave
- 727 Strawberry Place
- 666 Tranquil Bay Ct
- 670 Tranquil Bay Ct
- 812 Bitterroot St
- 672 Tranquil Bay Ct
- 667 Tranquil Bay Ct
- 665 Tranquil Bay Ct
- Plan 2242 at Caspian Bay - Reserves
- Plan 3066 Modeled at Caspian Bay - Reserves
- Plan 1849 at Caspian Bay - Reserves
- Plan 1901 Modeled at Caspian Bay - Reserves
- Plan 1644 at Caspian Bay - Reserves
- 669 Tranquil Bay Ct
- 686 Lunar Lake Way
- 824 Grape Vine Ave
- 828 Grape Vine Ave
- 822 Grape Vine Ave
- 830 Grape Vine Ave
- 701 Helmer Ct
- 820 Grape Vine Ave
- 832 Grape Vine Ave
- 825 Grape Vine Ave
- 823 Grape Vine Ave Unit 1
- 703 Helmer Ct
- 700 Canyon Country Cir
- 818 Grape Vine Ave
- 834 Grape Vine Ave
- 834 Grape Vine Ave Unit n/a
- 833 Grape Vine Ave
- 705 Helmer Ct
- 708 Canyon Country Cir
- 708 Canyon Country Cir Unit No
- 704 Canyon Country Cir
- 710 Canyon Country Cir