Estimated Value: $69,424 - $94,000
2
Beds
2
Baths
1,000
Sq Ft
$80/Sq Ft
Est. Value
About This Home
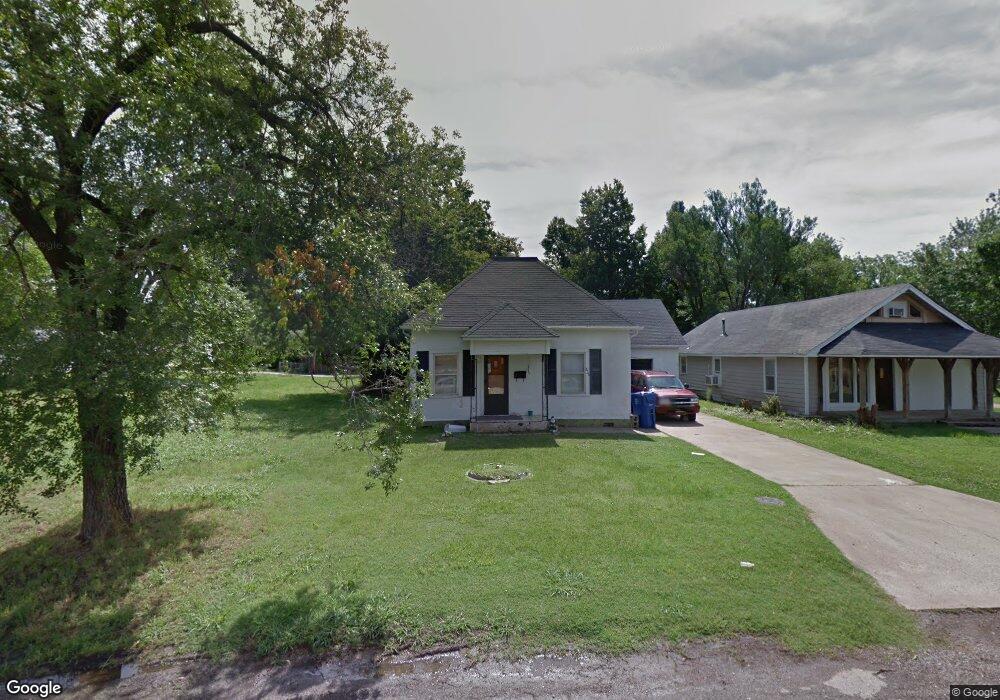
This home is located at 826 J St NW, Miami, OK 74354 and is currently estimated at $80,106, approximately $80 per square foot. 826 J St NW is a home located in Ottawa County with nearby schools including Miami High School and Mt. Olive Lutheran School.
Ownership History
Date
Name
Owned For
Owner Type
Purchase Details
Closed on
Feb 2, 2023
Sold by
Blm Group Llc
Bought by
Clark Jacob Mj
Current Estimated Value
Purchase Details
Closed on
Nov 17, 2021
Sold by
Walkfield Felicia and Walkfield Brian
Bought by
B L M Group Llc
Purchase Details
Closed on
Dec 30, 2008
Sold by
Corn Donald E and Corn Jeanne L
Bought by
Langston Felicia
Home Financials for this Owner
Home Financials are based on the most recent Mortgage that was taken out on this home.
Original Mortgage
$28,892
Interest Rate
6.08%
Mortgage Type
FHA
Purchase Details
Closed on
Dec 29, 2008
Sold by
Moore Wilbur Junior and Moore Wilbur
Bought by
Corn Donald E and Corn Jeanne L
Home Financials for this Owner
Home Financials are based on the most recent Mortgage that was taken out on this home.
Original Mortgage
$28,892
Interest Rate
6.08%
Mortgage Type
FHA
Purchase Details
Closed on
Jun 10, 1997
Bought by
Moore Wilbur Junior
Create a Home Valuation Report for This Property
The Home Valuation Report is an in-depth analysis detailing your home's value as well as a comparison with similar homes in the area
Home Values in the Area
Average Home Value in this Area
Purchase History
| Date | Buyer | Sale Price | Title Company |
|---|---|---|---|
| Clark Jacob Mj | $95,000 | -- | |
| B L M Group Llc | $10,000 | Ottawa Cnty Abstract & Ttl C | |
| Langston Felicia | $29,500 | None Available | |
| Corn Donald E | $20,500 | None Available | |
| Moore Wilbur Junior | $22,000 | -- |
Source: Public Records
Mortgage History
| Date | Status | Borrower | Loan Amount |
|---|---|---|---|
| Previous Owner | Langston Felicia | $28,892 | |
| Previous Owner | Corn Donald E | $28,892 |
Source: Public Records
Tax History Compared to Growth
Tax History
| Year | Tax Paid | Tax Assessment Tax Assessment Total Assessment is a certain percentage of the fair market value that is determined by local assessors to be the total taxable value of land and additions on the property. | Land | Improvement |
|---|---|---|---|---|
| 2025 | $370 | $4,031 | $513 | $3,518 |
| 2024 | $370 | $3,839 | $513 | $3,326 |
| 2023 | $370 | $3,656 | $513 | $3,143 |
| 2022 | $338 | $3,656 | $513 | $3,143 |
| 2021 | $345 | $3,852 | $459 | $3,393 |
| 2020 | $350 | $3,668 | $448 | $3,220 |
| 2019 | $287 | $3,493 | $342 | $3,151 |
| 2018 | $289 | $3,493 | $342 | $3,151 |
| 2017 | $293 | $3,493 | $342 | $3,151 |
| 2016 | $294 | $3,659 | $342 | $3,317 |
| 2015 | $216 | $2,433 | $344 | $2,089 |
| 2014 | $319 | $3,893 | $495 | $3,398 |
Source: Public Records
Map
Nearby Homes