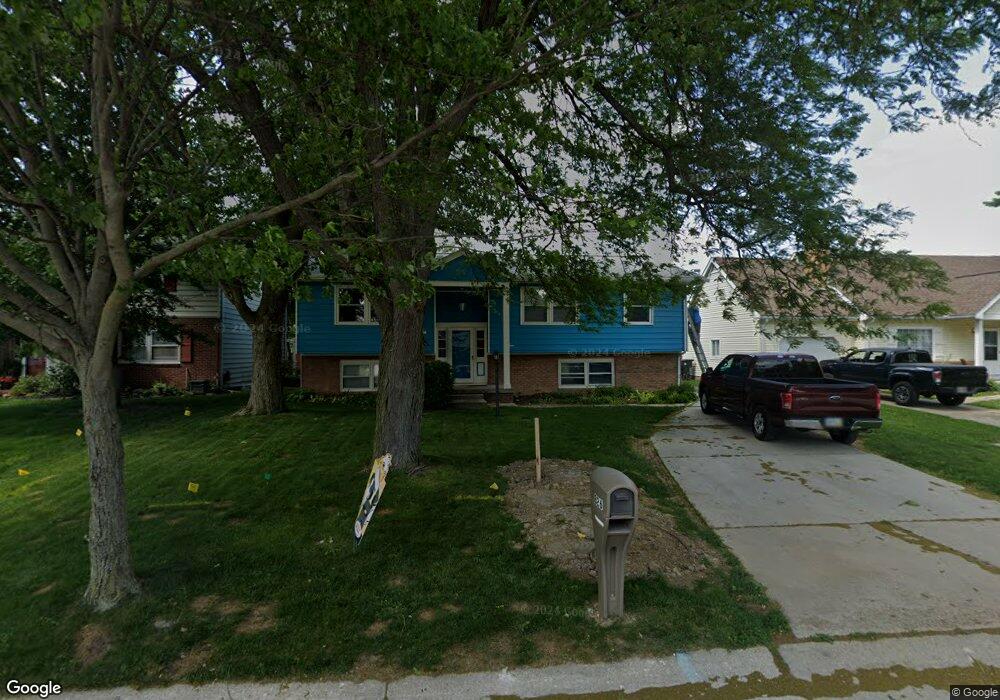
826 Jefferson Dr Bowling Green, OH 43402
Estimated Value: $256,000 - $317,000
4
Beds
3
Baths
2,670
Sq Ft
$105/Sq Ft
Est. Value
About This Home
This home is located at 826 Jefferson Dr, Bowling Green, OH 43402 and is currently estimated at $281,156, approximately $105 per square foot. 826 Jefferson Dr is a home located in Wood County with nearby schools including Bowling Green High School, Bowling Green Christian Academy, and Montessori School Of Bowling Green.
Ownership History
Date
Name
Owned For
Owner Type
Purchase Details
Closed on
Sep 30, 2009
Sold by
Mellon Kenneth E and Mellon Carol A
Bought by
Knell Robert A and Knell Cynthia J
Current Estimated Value
Home Financials for this Owner
Home Financials are based on the most recent Mortgage that was taken out on this home.
Original Mortgage
$131,326
Outstanding Balance
$86,060
Interest Rate
5.15%
Mortgage Type
FHA
Estimated Equity
$195,096
Purchase Details
Closed on
Jul 21, 1995
Sold by
Laubengayer William L
Bought by
Mellon Kenneth E and Mellon Carol A
Home Financials for this Owner
Home Financials are based on the most recent Mortgage that was taken out on this home.
Original Mortgage
$103,550
Interest Rate
7.5%
Mortgage Type
New Conventional
Purchase Details
Closed on
Apr 8, 1985
Bought by
Laubengayer William L
Create a Home Valuation Report for This Property
The Home Valuation Report is an in-depth analysis detailing your home's value as well as a comparison with similar homes in the area
Home Values in the Area
Average Home Value in this Area
Purchase History
| Date | Buyer | Sale Price | Title Company |
|---|---|---|---|
| Knell Robert A | $133,800 | American Title Agency | |
| Mellon Kenneth E | $109,000 | -- | |
| Laubengayer William L | $70,500 | -- |
Source: Public Records
Mortgage History
| Date | Status | Borrower | Loan Amount |
|---|---|---|---|
| Open | Knell Robert A | $131,326 | |
| Closed | Mellon Kenneth E | $103,550 |
Source: Public Records
Tax History Compared to Growth
Tax History
| Year | Tax Paid | Tax Assessment Tax Assessment Total Assessment is a certain percentage of the fair market value that is determined by local assessors to be the total taxable value of land and additions on the property. | Land | Improvement |
|---|---|---|---|---|
| 2024 | $3,104 | $71,855 | $11,550 | $60,305 |
| 2023 | $3,104 | $71,860 | $11,550 | $60,310 |
| 2021 | $2,492 | $57,440 | $9,450 | $47,990 |
| 2020 | $2,559 | $57,440 | $9,450 | $47,990 |
| 2019 | $2,392 | $51,170 | $9,450 | $41,720 |
| 2018 | $2,380 | $51,170 | $9,450 | $41,720 |
| 2017 | $2,308 | $51,170 | $9,450 | $41,720 |
| 2016 | $2,226 | $47,880 | $9,450 | $38,430 |
| 2015 | $2,226 | $47,880 | $9,450 | $38,430 |
| 2014 | $2,295 | $47,880 | $9,450 | $38,430 |
| 2013 | $2,471 | $47,880 | $9,450 | $38,430 |
Source: Public Records
Map
Nearby Homes
- 707 W Poe Rd
- 29 Darlyn Dr
- 1124 Raven Rd
- 915 Manitoba Dr
- Daffodil II Plan at Aspire at Toussaint Springs
- Water Lily Plan at Aspire at Toussaint Springs
- Oleander Plan at Aspire at Toussaint Springs
- Sweet Pea Plan at Aspire at Toussaint Springs
- Forsythia Plan at Aspire at Toussaint Springs
- Goldenrod Plan at Aspire at Toussaint Springs
- 1303 Finch Dr
- 958 N Dixie Hwy
- 1048 N Main St Unit 56
- 1048 N Main St Unit 37
- 1048 N Main St Unit 103
- 1048 N Main St Unit 46
- 614 Pasteur Ave
- 1206 N Dixie Hwy
- 315 Parkview Dr
- 810 Lelanford Cir
- 822 Jefferson Dr
- 830 Jefferson Dr
- 834 Jefferson Dr
- 818 Jefferson Dr
- 32 Trafalgar Bend
- 838 Jefferson Dr
- 823 Jefferson Dr
- 819 Jefferson Dr
- 827 Jefferson Dr
- 814 Jefferson Dr
- 1099 Revere Dr
- 831 Jefferson Dr
- 842 Jefferson Dr
- 30 Trafalgar Bend
- 835 Jefferson Dr
- 810 Jefferson Dr
- 41 Trafalgar Bend
- 42 Trafalgar Bend
- 29 Trafalgar Bend
- 839 Jefferson Dr