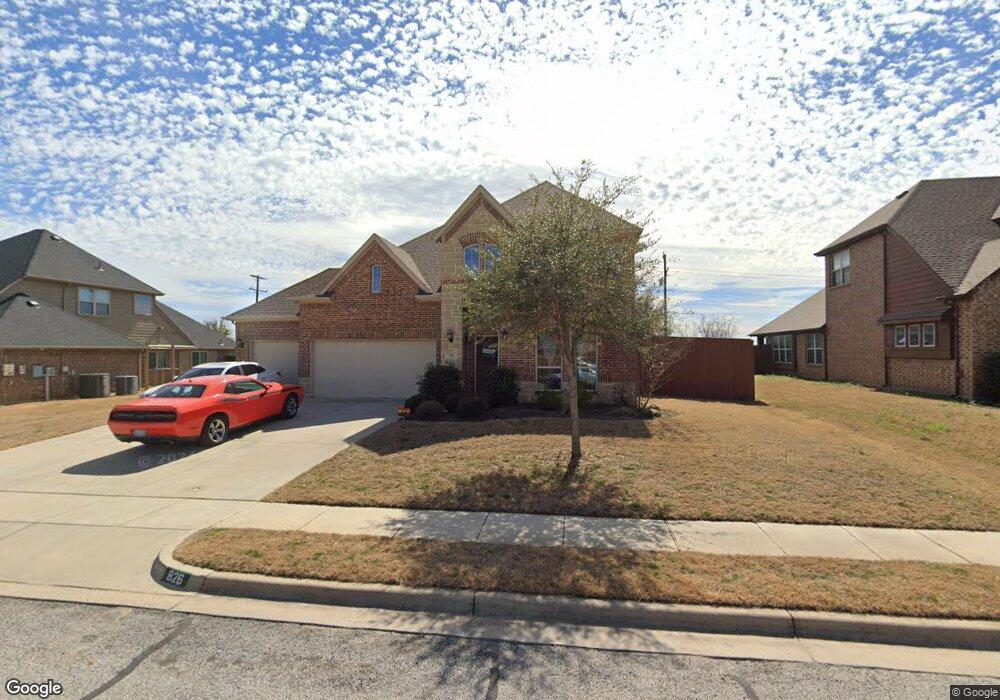
826 Magnolia Dr Weatherford, TX 76086
Estimated Value: $503,000 - $544,000
4
Beds
4
Baths
3,226
Sq Ft
$162/Sq Ft
Est. Value
About This Home
This home is located at 826 Magnolia Dr, Weatherford, TX 76086 and is currently estimated at $523,330, approximately $162 per square foot. 826 Magnolia Dr is a home located in Parker County with nearby schools including Wright Elementary School, Hall Middle School, and Weatherford High School.
Ownership History
Date
Name
Owned For
Owner Type
Purchase Details
Closed on
Nov 1, 2018
Sold by
Tonips Eric and Tonips Rachel
Bought by
Miller Michael J and Miller Laura C
Current Estimated Value
Home Financials for this Owner
Home Financials are based on the most recent Mortgage that was taken out on this home.
Original Mortgage
$315,065
Outstanding Balance
$275,898
Interest Rate
4.6%
Mortgage Type
VA
Estimated Equity
$247,432
Purchase Details
Closed on
Oct 13, 2015
Sold by
Stonehollow Homes Llc
Bought by
Tonips Eric
Home Financials for this Owner
Home Financials are based on the most recent Mortgage that was taken out on this home.
Original Mortgage
$252,539
Interest Rate
3.93%
Mortgage Type
New Conventional
Purchase Details
Closed on
May 8, 2015
Sold by
Shadow Wolf Llc
Bought by
Tonips Eric
Purchase Details
Closed on
Oct 4, 2005
Bought by
Tonips Eric
Create a Home Valuation Report for This Property
The Home Valuation Report is an in-depth analysis detailing your home's value as well as a comparison with similar homes in the area
Home Values in the Area
Average Home Value in this Area
Purchase History
| Date | Buyer | Sale Price | Title Company |
|---|---|---|---|
| Miller Michael J | -- | None Available | |
| Tonips Eric | -- | Fatco | |
| Tonips Eric | -- | -- | |
| Tonips Eric | -- | -- |
Source: Public Records
Mortgage History
| Date | Status | Borrower | Loan Amount |
|---|---|---|---|
| Open | Miller Michael J | $315,065 | |
| Previous Owner | Tonips Eric | $252,539 |
Source: Public Records
Tax History Compared to Growth
Tax History
| Year | Tax Paid | Tax Assessment Tax Assessment Total Assessment is a certain percentage of the fair market value that is determined by local assessors to be the total taxable value of land and additions on the property. | Land | Improvement |
|---|---|---|---|---|
| 2025 | $5,512 | $465,449 | -- | -- |
| 2024 | $5,512 | $404,954 | -- | -- |
| 2023 | $5,512 | $368,140 | $0 | $0 |
| 2022 | $7,424 | $334,680 | $25,000 | $309,680 |
| 2021 | $8,037 | $334,680 | $25,000 | $309,680 |
| 2020 | $7,845 | $324,690 | $25,000 | $299,690 |
| 2019 | $8,291 | $324,690 | $25,000 | $299,690 |
| 2018 | $7,867 | $306,700 | $20,000 | $286,700 |
| 2017 | $8,070 | $306,700 | $20,000 | $286,700 |
| 2016 | $6,974 | $265,040 | $20,000 | $245,040 |
| 2015 | $258 | $10,000 | $10,000 | $0 |
| 2014 | $377 | $15,000 | $15,000 | $0 |
Source: Public Records
Map
Nearby Homes
- 1921 Bay Laurel Dr
- 1015 W Park Ave Unit D
- 1015 W Park Ave Unit LOT A
- 1015 W Park Ave Unit LOT B
- 842 Randall Rd
- 3770 Bethel Rd
- 914 Randall Rd
- 741 Nandina Rd
- 1813 Barberry Way
- 2209 Caroline Dr
- 1816 Barberry
- 825 Jodie Dr
- 909 Jodie Dr
- 1220 Scott Dr
- 612 W Park Ave
- 2533 Hadley St
- 1036 Deer Valley Dr
- 2532 Hadley St
- 2361 Waggoner Ranch Dr
- 124 Candleridge Ct
- 830 Magnolia Dr
- 822 Magnolia Dr
- 834 Magnolia Dr
- 834 Magnolia Dr
- 818 Magnolia Dr
- 2030 Lindentree Dr
- 2029 Starwood Dr
- 838 Magnolia Dr
- 2026 Lindentree Dr
- 814 Magnolia Dr
- 2025 Starwood Dr
- 2029 Lindentree Dr
- 2030 Starwood Dr
- 842 Magnolia Dr
- 2022 Lindentree Dr
- 2021 Starwood Dr
- 2025 Lindentree Dr
- 2026 Starwood Dr
- 2021 Lindentree Dr
- 846 Magnolia Dr